Quick Answer
AdSpyder’s 5-year Google Shopping ads archive — 94 million+ ads from 2022–2026 — shows the median ad-shown price is $47 USD-equivalent, the $10–$50 band holds 36% of all ads, only 7.4% of Shopping ads show a visible discount signal, and fewer than 6% use a bundle strategy. Median price in India is ~$12 — 3.5× lower than the US. Marketplace giants show a $29 median vs $41 for handmade/curated sellers. None of this data exists in any competitor repricing tool or shopping guide — it comes from AdSpyder’s actual ad archive. You can benchmark your own competitors’ prices using AdSpyder’s Shopping Ads Spy.
Every repricing tool, dynamic pricing guide, and Google Shopping strategy blog will tell you to track your competitors and keep prices competitive. None of them will show you what competitors actually charge in their live Shopping ads — because they don’t have the data to do that.
AdSpyder’s Google Shopping ads archive holds 94 million+ ads crawled across 100+ countries from 2022 to 2026. We drew a uniform random sample of 1,000 ads, extracted every price string, discount signal, bundle indicator, retailer type, and carousel position from a separate 2,000-doc sample, and ran the numbers.
What follows is not a framework about dynamic pricing or ROAS optimization. It is the actual distribution of how competitors price their Shopping ads — by price band, by market, by retailer type, and by format. The kind of data that should inform your pricing decisions before you touch a single bid or feed setting. Data is current as of May 2026.
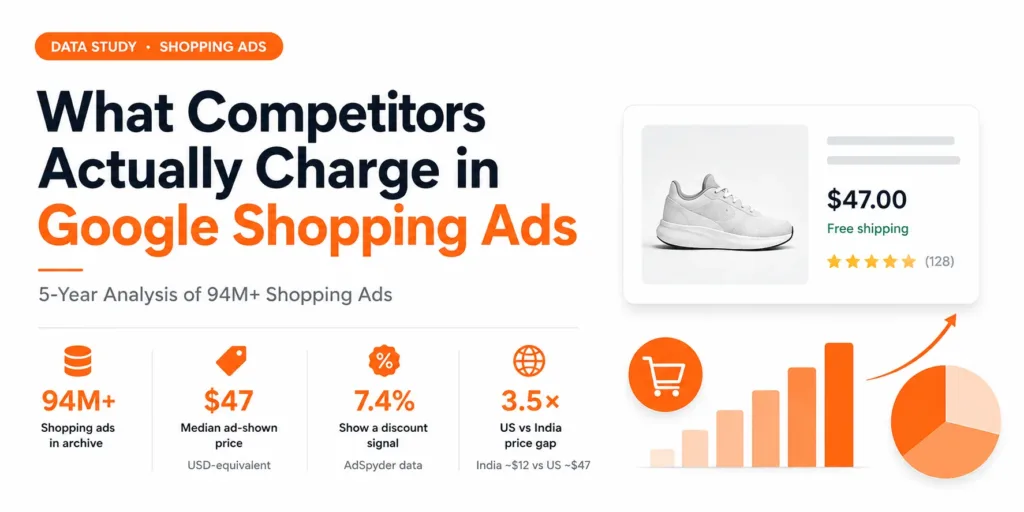
94M+
Shopping ads in archive
5-year archive, 2022–2026
$47
Median ad-shown price
USD-equivalent, n=773
7.4%
Show a discount signal
AdSpyder platform data, May 2026
3.5×
US vs India price gap
AdSpyder platform data, May 2026
94M+ Shopping ads. 100+ countries. Exact prices on every creative.
See the exact price your competitors show in Shopping ads — with date filters back to 2018.
In This Study
Why Google Shopping Ads Are Price-First Ads
In a search ad, the user reads a headline first. In a Shopping ad, the user compares products first. Price appears next to the image, store name, title, and sometimes a rating — before any click happens. That changes the job of the ad entirely.
Most Shopping guides focus on dynamic pricing, feed optimization, ROAS targets, and bid strategies. Those are useful. But they skip the more fundamental competitive question: what are competitors actually showing in their visible product listing price? Not their cost. Not their margin. The number on the card.
A competitor’s Shopping ad reveals three pricing decisions before you visit their site:
- What price band they are willing to advertise in paid product listings.
- Whether they lead with discounting or simple face-value pricing.
- Whether they sell single SKUs, bundles, multipacks, or kit-style products.
Why this data is different from repricing tools
Tools like Omnia, Prisync, and Pricefy track competitor prices by scraping live product pages or comparison shopping engines. They answer “what is my competitor charging right now?” AdSpyder’s archive answers a different and harder question: “across 94 million Shopping ads over 5 years, what prices do competitors actually put into their ads across 100+ countries?” The scale and scope of that data set is what makes this analysis unique.
How This Data Was Collected
Every number in this study comes from AdSpyder’s production data. The Google Shopping ads archive was built by crawling Shopping results across 100+ countries from January 2022 through May 2026. We drew a uniform random sample of 1,000 ads and extracted the price field, title text, and retailer domain. Carousel position data comes from a separate 2,000-doc random sample.
Important data note
Price strings are not indexed for aggregation in AdSpyder’s OpenSearch mapping. All pricing figures are from a 1,000-doc random sample (773 had a USD-convertible price). We use median prices throughout — not means — because long-tail markets (CLP, COP, ARS) produce extreme outliers that distort averages. USD conversions use approximate May 2026 FX rates (±5%). Source: AdSpyder Google Shopping ads archive, May 2026.
How Competitor Shopping Ads Are Actually Priced: The Full Distribution
The most important pricing pattern is not the average — it’s the distribution. Averages get pulled by extreme prices, unusual currencies, or high-ticket outliers. Buckets and the median are what actually matter for ecommerce pricing intelligence.
The $10–$50 band is by far the most crowded — 36% of all ads with a parseable price land here. More than half of all Shopping ads (52%) are priced somewhere between $10 and $200. The median across all markets is $47 USD-equivalent. The 25th percentile is $16.50; the 75th is $189.
36%
Ads priced $10–$50
Largest single bucket
$47
Median price (all markets)
USD-equivalent, n=773
52%
Ads between $10–$200
The mainstream band
10%
Ads above $1,000
High-ticket is a real segment
| Price Band | Ads (n) | Share | What It Means |
|---|---|---|---|
| Under $10 | 123 | 15.9% | Impulse and commodity tier. High volume required to justify ad spend. |
| $10 – $50 | 278 | 35.9% ← Most Crowded | Maximum competition. Price differentiation is hardest here. |
| $50 – $200 | 193 | 25.0% | Mid-range consideration. Buyers compare more carefully here. |
| $200 – $1,000 | 100 | 12.9% | Premium tier. Fewer competitors but higher CPC. |
| Over $1,000 | 79 | 10.2% | High-ticket. Brand trust and landing page proof matter more. |
Source: AdSpyder Google Shopping ads archive, 1,000-ad random sample (773 parseable prices), May 2026. 25th percentile: $16.50; 75th percentile: $189.
Strategic interpretation
If your competitors cluster around $10–$50 and you enter at $120, your product must justify the difference immediately through image quality, title clarity, reviews, shipping promise, brand trust, or bundle value. Price alone will not carry the ad — but a clear price signal can sink it.
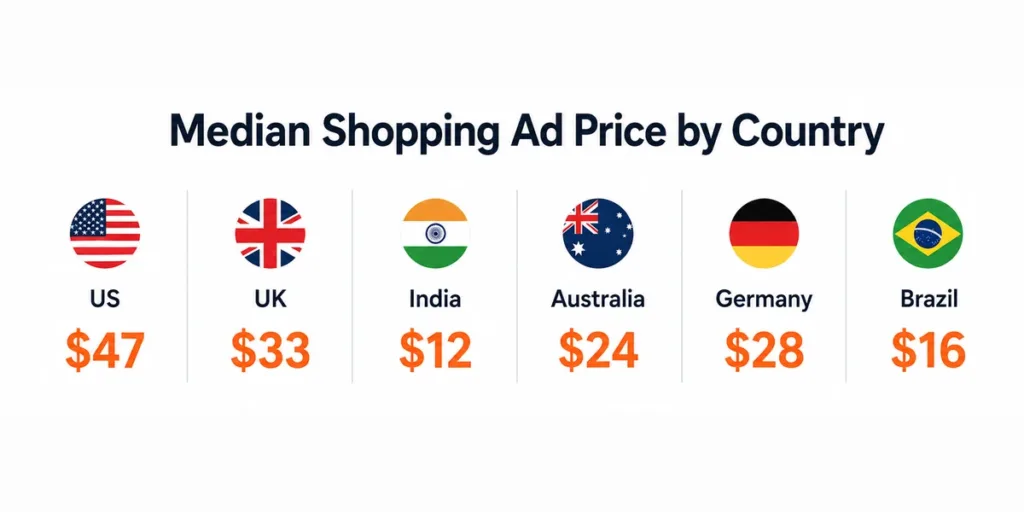
Median Shopping Ad Price by Country: The US, UK, and India Gap
The $47 global median is a useful starting point but a dangerous endpoint. The moment you filter by country, the picture changes completely.
The median ad-shown price in India is approximately $12 USD-equivalent — roughly 3.5× lower than the US median of $45, and 3× lower than the UK’s $38. This is not a currency conversion artifact. It reflects the actual price tier being advertised in each market. Advertisers pitch lower-priced products to price-sensitive markets because those are the products that move.
$45
Median price (USD equiv.)
n=239 in sample
$38
Median price (USD equiv.)
n=104 in sample
$12
Median price (USD equiv.)
n=55 in sample
| Market | Sample (n) | Median Price (USD Equiv.) | Pricing Read |
|---|---|---|---|
| 🇺🇸 United States | 239 | $45 | Mid-ticket visible pricing. Close to global median. |
| 🇬🇧 United Kingdom | 104 | $38 | Slightly below US median. |
| 🇨🇦 Canada | 35 | $59 | Slightly above US median. |
| 🇦🇺 Australia | 42 | $79 | Higher visible price tier than US/UK. |
| 🇧🇷 Brazil | 37 | $22 | Lower-tier pricing reflecting market price sensitivity. |
| 🇮🇳 India | 55 | $12 | 3.5× lower than US. Different tier entirely. |
Source: AdSpyder Google Shopping ads archive, 1,000-doc random sample. USD conversions at approximate May 2026 FX rates. Mexico ($116) and Chile ($111) show elevated medians due to higher-value product categories common on Mercado Libre.
Warning
Don’t use a global average to set pricing in a single market. If you benchmark against the $47 median while selling in India, you’ll price yourself out of your customer’s consideration set before they even click. Market-specific competitor data is the only useful benchmark.
Discount Signals Are Less Common Than Most Marketers Expect
Only 7.4% of Shopping ads in the sample showed two prices in the price field — the strike-through pattern that signals “was $X, now $Y.” More than 9 out of 10 Shopping ads did not lead with an obvious visible discount.
This matters because discounting often looks bigger in ecommerce strategy decks than it does inside actual Shopping ad listings. Most advertisers — including large marketplaces — compete with the face-value price, not a visible discount mechanic. The product with the lowest clean price wins more often than the product with the most prominent strikethrough.
7.4%
Show a two-price discount signal
74 of 1,000 ads in sample
92.6%
Show a single face-value price only
The dominant Shopping ad pattern
Strategic implication
When fewer than 1 in 10 Shopping ads in your category shows a discount signal, a well-executed “was / now” price becomes a genuine differentiator — not table stakes. If your category has low discount-signal density, a well-timed sale price is an unusual and visible move. Don’t add one by default — use it deliberately when you need to stand out.
Bundles and Multipacks Are Still a Minority Strategy
A bundle can make sense when you need to lift average order value, protect margin, or escape a direct price comparison. But how common is the strategy actually in live Shopping ads?
Our NLP scan of 1,000 Shopping ad titles — flagging keywords like “pack of”, “bundle”, “combo”, “kit”, “multipack”, “x6”, “N pcs” — found just 5.7% of ads using bundle or multi-pack language. Even on marketplaces like Amazon and Etsy where bundles are common in organic listings, the Shopping ad titles in our sample overwhelmingly advertised single SKUs.
5.7%
Bundle / multi-pack ads
57 of 1,000 ads in sample
94.3%
Single SKU ads
The near-universal default
If you’re in a category where bundles make product sense — supplements, stationery, kitchen accessories, pet supplies — advertising a bundle explicitly in your title is genuinely unusual. The comparison set your shopper scrolls through is almost entirely single-item listings. An explicit multi-pack title is a differentiator, not a norm.
Source: AdSpyder Google Shopping ads archive, 1,000-doc random sample. Bundle detection: regex match on title text for “pack”, “bundle”, “combo”, “kit”, “multipack”, “set of N”, “xN”, “N pcs/pieces”. May 2026.
Pricing by Retailer Type: Marketplaces vs Specialist Sellers
The Shopping archive doesn’t carry a product category field — so there’s no clean “electronics vs fashion” breakdown from this data. What we do have are retailer names, and retailer type turns out to be a reliable pricing proxy.
General-merchandise marketplaces in the sample — Amazon across all country storefronts, eBay, Walmart, Mercado Libre, Lazada, Shopee, AliExpress, Alibaba, Flipkart, Target — showed a median ad price of ~$29 USD-equivalent. These are platforms structurally competing on price floor, and the ad data confirms it.
Etsy — representing handmade, vintage, and artisan goods — showed a median of ~$41, approximately 40% higher than the marketplace median. Handmade and curated positioning commands a real price premium in Shopping ads.
| Retailer Type | Median Price (USD) | Sample (n) | Key Examples in Archive |
|---|---|---|---|
| General Marketplaces | $29 | 224 | Amazon, eBay, Walmart, Mercado Libre, Lazada, Shopee, AliExpress, Flipkart, Target, Alibaba |
| Handmade / Curated | $41 | 27 | Etsy |
Note: Sample sizes for fast-fashion and luxury verticals were insufficient for a reliable per-vertical median. Archive also includes SHEIN, ASOS, ABOUT YOU, TATA CLiQ Luxury, Allegro, Falabella, Americanas.com. Source: AdSpyder platform data, May 2026.
What this means for your benchmark
If your product competes directly with Amazon or Walmart SKUs, your benchmark should be the ~$29 marketplace median — not the $47 overall median. If you’re a DTC brand or artisan seller, the $41 Etsy median is the right anchor. Use AdSpyder’s country and keyword filters together to isolate the right competitive slice for your specific product.
Where Do Shopping Ads Actually Appear? Carousel Position Data
Position matters in Shopping because the format is visual — a lower slot means less visibility regardless of how competitive your price is. The carousel position distribution from AdSpyder’s 2,000-ad sample tells a story most advertisers haven’t seen before.
The median carousel slot in the archive is 8. Only about 1 in 5 Shopping ads appears in the top 3 positions. This means pricing research should cover slots 4–10 — not just the premium placements. The competitive landscape your customers actually scroll through is deeper than the top row, and 96.5% of Shopping ads carry a product image. Image quality and price are the two visible signals competing for clicks.
19.4%
Top 3 slots
Prime visibility
36.3%
Slots 4–10
Scroll-to visibility
29.4%
Slots 11–20
Below-fold
Slot 8
Median position
Most ads aren’t top-row
Source: AdSpyder Google Shopping ads archive, 2,000-doc random sample. Position = carousel slot (1 = top-left). May 2026.
Mistakes to Avoid When Reading Shopping Ad Price Data
Using the global median as your benchmark
The $47 global median is a starting point, not your answer. India’s median is $12. Australia’s is $79. Always filter by your specific market before drawing any pricing conclusions.
Only looking at top-row ads
Only 19.4% of Shopping ads appear in the top 3 slots. The median slot is 8. Your real competition is the full carousel — price against all of it, not just what you see in slot 1.
Assuming discounts are standard
Only 7.4% of Shopping ads show a discount signal. If you add a “was / now” price thinking everyone does it, you’re wrong. It’s unusual — which is exactly why it can stand out when done deliberately.
Benchmarking against the wrong retailer type
Amazon’s median Shopping price is ~$29. Etsy’s is ~$41. If you’re a DTC brand comparing yourself to marketplace giants, you’re using the wrong competitive set entirely.
How to Benchmark Competitor Shopping Prices Using AdSpyder
The data above tells you the landscape. Here’s how to run the same analysis for your specific product and market using AdSpyder’s Shopping Ads Spy. This workflow takes under 20 minutes per competitor and produces a research output no repricing tool can give you.
Search your core product keyword, filtered to your country
Open Shopping Ads Spy and enter the keyword your competitors would target (e.g. “wireless earbuds”, “yoga mat”, “protein powder 2kg”). Apply your country filter before reading any results. Based on the data above, the US, UK, and India have meaningfully different price medians — benchmarking in the wrong geography will send you in the wrong direction.
Group ads into price bands — don’t just find the cheapest
Sort results into low (<$10), mid ($10–$50), upper-mid ($50–$200), premium ($200–$1k), and high-ticket (>$1k) bands. This tells you whether your market is price-led or value-led. If 70% of ads are in the $10–$50 band and you’re entering at $80, you need a clear positioning rationale visible in the ad itself.
Count discount and bundle signals in your sample
Note how many of the first 20 competitor ads show a two-price discount string. Note how many use bundle or multi-pack title language. If fewer than 10% show discounts, a well-timed “was / now” price is a real differentiator. If no competitors are bundling and your product makes sense as a multi-pack, you have whitespace.
Decide: compete on price, value, bundle, or trust
If you can’t beat the visible price, improve what the shopper sees: product image quality, title specificity, explicit shipping promise, social proof, or bundle value. Price is one signal in the carousel — image quality and title clarity carry as much weight at the point of comparison.
Track specific competitor domains over time with date filters
AdSpyder’s domain analysis lets you pull all Shopping ads from a specific competitor’s domain across any date window. Apply date filters to detect seasonal price shifts — before Black Friday, end of quarter, or after a new product launch. Knowing a competitor’s price before they change yours is the real competitive intelligence win.
Set up ongoing competitor tracking
AdSpyder users have set up 8,600+ active competitor tracking projects (AdSpyder platform data, May 2026). Rather than one-time audits, track the competitors whose pricing you care about most. When they change their Shopping ad price, you’ll see it in the archive — not when it’s already cost you revenue.
Manual Price Research vs Using AdSpyder
| Task | Repricing Tools (Omnia, Prisync) | AdSpyder Shopping Ads Spy |
|---|---|---|
| See competitor prices right now | ✅ Live data | ✅ Current + archive since 2018 |
| See prices as shown in the ad itself | ❌ Product page price only | ✅ Exact ad price string |
| Filter by country | ⚠️ Depends on plan/config | ✅ 100+ countries, one click |
| See historical price changes in ads | ❌ Limited historical depth | ✅ Date range filter, back to 2018 |
| Detect bundle vs single SKU patterns | ❌ Not available | ✅ Title-level search |
Shopping Ads Pricing Research Checklist
Run through this before setting your Shopping campaign price:
✓ Searched competitor keyword in AdSpyder Shopping Ads Spy, filtered to your specific target country
✓ Grouped competitor ads into price bands — identified the floor, median, and ceiling
✓ Counted how many competitor ads show a discount / strike-through signal vs a single face-value price
✓ Checked whether any top competitors use bundle or multi-pack title language
✓ Confirmed you’re comparing against the right retailer type — marketplace median ($29) vs DTC/curated ($41+)
✓ Decided on positioning: compete on price, value, bundle, image quality, or trust — based on data, not instinct
✓ Used domain search on top 2–3 direct competitors to check for seasonal price shifts in the archive
✓ Set up a competitor tracking project so you catch pricing changes the moment they happen
AdSpyder Shopping Ads Spy · 94M+ Ads Indexed
Stop guessing your Shopping ad price. Start reading the data.
Search competitor Shopping ads by keyword and country. See the exact price shown, the product title, and the retailer — all from a 5-year archive of 94M+ Shopping ads across 100+ countries.
23,000+ users · 10 platforms · No credit card required
Frequently Asked Questions
Data note: All pricing data in this study is drawn from AdSpyder’s Google Shopping ads archive (94M+ ads, January 2022 – May 2026). A uniform random sample of 1,000 ads was used for price, discount, and bundle analysis; 773 had a USD-convertible price. Carousel position distribution is from a separate 2,000-doc random sample. Median prices are used throughout; means are suppressed due to extreme outliers in Latin American currency markets (CLP, COP, ARS). USD conversions use approximate May 2026 FX rates (±5%). Source: AdSpyder platform data, May 2026.