
Quick Answer
Based on AdSpyder’s analysis of 20,000 real campaigns, the typical Amazon Sponsored Ads campaign runs 5 variants (median) and the typical Google Shopping campaign runs 16. Single-variant campaigns are effectively nonexistent among active advertisers on both platforms. Use AdSpyder’s Ad Library — 360 million+ ads across 10 platforms — to benchmark exactly what your competitors are running right now.
Most answers to “how many ad variants to run” are based on opinion. Some say test three creatives. Others say generate hundreds with AI. Neither answer comes from actually measuring what active advertisers at scale do. This one does.
AdSpyder pulled campaign-level data from 10,000 Amazon Sponsored Ad campaigns and 10,000 Google Shopping campaigns — the two platforms in our archive where campaign IDs map to actual marketer-defined campaigns. We added advertiser-level data from Meta and Google Search. The picture is consistent across all four: single-creative campaigns are not what top advertisers run on any platform.
This blog shows you the real numbers, explains what they mean per platform, and gives you the exact workflow to benchmark your own variant count against real competitors — not invented benchmarks.
5
Median Amazon variants
per Sponsored Ads campaign — 51% of campaigns run 4–10
16
Median Shopping variants
per Google Shopping campaign — 87% sit in the 11–50 range
239
Median Meta ads per page
for active Meta advertisers in AdSpyder’s real-time index
~0%
Single-variant campaigns
on Amazon and Shopping — effectively nonexistent among active advertisers
AdSpyder platform data, May 2026. Analysis of 20,000 campaigns (Amazon + Google Shopping) and 10,000 advertiser samples (Meta, Google Search).
In This Article
How This Data Was Measured
The variant-count question seems straightforward. In practice it requires choosing the right unit of analysis per platform — because “campaign” means something different in every ad archive.
| Platform | Unit Used | Why |
|---|---|---|
| Amazon Sponsored Ads | Variants per campaign | Campaign ID maps to a real marketer-defined Amazon Ads campaign |
| Google Shopping | Products per campaign | Campaign ID maps to a real Shopping campaign feed |
| Meta (Facebook + Instagram) | Ads per advertiser page | Meta campaign ID equals Facebook post ID — ads per page is the honest substitute |
| Google Search | Ads per advertiser domain | Campaign ID is a scraper batch grouping, not a marketer-defined campaign |
Important caveat
Amazon and Google Shopping numbers are true campaign-level variant counts. Meta and Google Search numbers are advertiser-level and represent cumulative creative output — not what is live in a single campaign at one moment. Both are useful; they measure different things. Do not mix them in the same comparison.
See what your competitors are actually running — right now
360M+ ads across 10 platforms. Search by competitor domain, filter by date, get their real variant count in minutes.
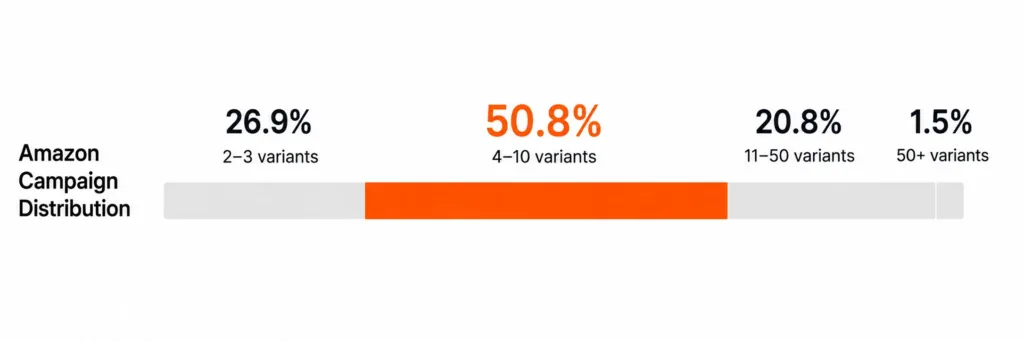
Amazon Sponsored Ads: The Median Is 5, the Mainstream Is 4–10
Amazon is the cleanest dataset for this analysis because the campaign ID field in the Sponsored Ads archive actually maps to an Amazon Ads campaign the way a PPC manager understands the term. We sampled the 10,000 most-active campaigns by ad count.
| Variant Bucket | % of Campaigns | What This Signals |
|---|---|---|
| 1 variant | ~0% | Effectively nonexistent among active advertisers |
| 2–3 variants | 26.9% | Minimal testing — usually small brands or tightly controlled SKUs |
| 4–10 variants (majority) | 50.8% | The mainstream: multiple images, copy angles, or product listings tested |
| 11–50 variants | 20.8% | Scaled advertisers — multiple SKUs or seasonal stacks |
| 50+ variants | 1.5% | Heavy catalog advertisers — outlier max was 473 variants |
Median
5
Average
9
90th Pct.
19
99th Pct.
61
Source: AdSpyder Amazon Sponsored Ads archive, top 10,000 campaigns by ad count — AdSpyder platform data, May 2026.
The practical takeaway: if you’re running Amazon Sponsored Ads with one or two creatives, you’re below the floor of what active advertisers are already doing. The mainstream band is 4 to 10 — where 51% of campaigns sit. Getting to that range is the minimum bar, not the aspirational target.
The 473-variant outlier is a large catalog advertiser, not a signal to run hundreds of versions of your hero SKU. Use AdSpyder’s Amazon Ad Library to see how many variants your category competitors are actually running before setting your own target.
Google Shopping: Median of 16, and 87% of Campaigns Run 11–50
Google Shopping is structurally different from search text ads — each “variant” is a product feed item, so volume naturally reflects catalog depth as much as creative testing. The numbers are still striking: running under 10 products puts you in the bottom 8% of active Shopping campaigns.
| Variant Bucket | % of Campaigns | Implication |
|---|---|---|
| 1–3 variants | ~0% | Practically nonexistent among active Shopping advertisers |
| 4–10 variants | 8.0% | Small niche catalogs — the exception, not the rule |
| 11–50 variants (dominant) | 86.6% | The norm — brands advertising category depth, not just hero SKUs |
| 50+ variants | 5.5% | Large retailers — outlier max was 2,255 variants in one campaign |
Median
16
Average
23
90th Pct.
40
99th Pct.
99
Source: AdSpyder Google Shopping ads archive, top 10,000 campaigns by ad count — AdSpyder platform data, May 2026.
Shopping vs. text ad variants
A Shopping campaign with 16 variants is advertising 16 different product listings — not 16 headline rewrites. If you’re comparing to text ad creative testing, Amazon’s numbers (median: 5) are the more direct parallel. Use AdSpyder’s Shopping Ads Spy to see how competitors structure their product feeds.
Meta (Facebook + Instagram): 239 Ads Per Active Page, and 88% Are Images
Meta’s campaign ID structure doesn’t support true campaign-level variant analysis the way Amazon does. What we measure instead is ads per advertiser page — and the numbers reveal the real scale of creative production at the top of the market.
| Data Source | Median Ads/Page | 99th Percentile | What It Represents |
|---|---|---|---|
| Meta Real-time Feed | 239 | 3,253 | Ads currently live or recently active (rolling ~90 days) |
| Meta Historical Archive | 712 | 23,989 | All ads ever captured per page since 2018 |
Source: AdSpyder Meta real-time and historical archives, top 10,000 advertiser pages — AdSpyder platform data, May 2026.
The real-time number is the operationally useful one: the median active Meta advertiser in AdSpyder’s feed has 239 ads on record. That’s their recent active creative stack — not lifetime production.
There’s a second finding here that challenges a widespread assumption. Across AdSpyder’s Meta historical archive of 44 million+ ads, 88% are static images and 12% are video (AdSpyder platform data, May 2026). The “video-first Meta strategy” narrative doesn’t match what most advertisers are actually running. The dominant format is static imagery by a wide margin. Build your Meta variant testing to match that reality: mostly image-led, with a separate video section.
What this means for your Meta strategy
If a competitor has 239 ads on their page and you’re running 15, the gap is not strategy — it’s creative production volume. Use Facebook Ads Spy and Instagram Ads Spy to measure the gap precisely, then build the production system that can close it.
Google Search: 3,147 Ads Per Advertiser — Volume Compounds Over Time
For Google Search, the total ad volume per advertiser domain across AdSpyder’s full archive (164M+ Google Search ads) is the best available measure. This is a lifetime view — the cumulative output of years of PPC testing — not a snapshot of what is live at any one moment.
Median Ads / Domain
3,147
Average
9,866
99th Percentile
89,279
Source: AdSpyder Google Search archive, top 10,000 advertiser domains by ad count — AdSpyder platform data, May 2026.
The mean is much higher (9,866) because outlier advertisers pull it up — the single highest-volume domain in the sample had 11.8 million ads captured. That is the output of years of consistent creative testing, not one aggressive launch cycle. The advertisers with the largest ad libraries got there by running, testing, and refreshing systematically — volume compounds.
Use Google Ads Spy to see what competitors are currently running in search and how their current count compares to their historical volume. The gap between those two numbers tells you how aggressively they refresh creative.
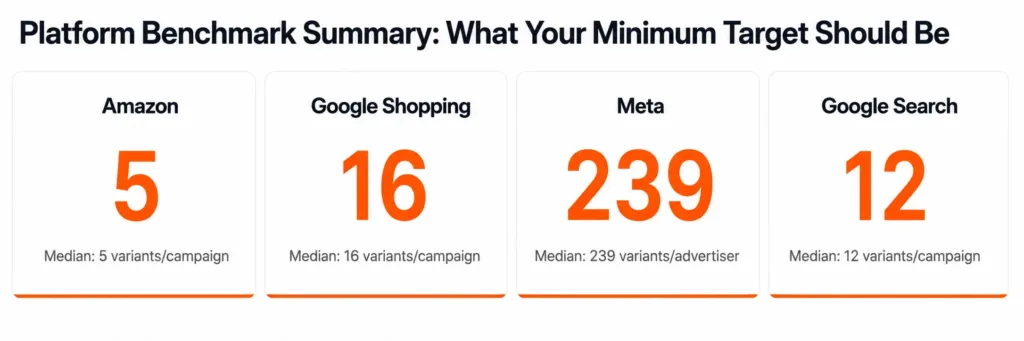
Platform Benchmark Summary: What Your Minimum Target Should Be
| Platform | Unit | Median | Dominant Bucket | Minimum Target |
|---|---|---|---|---|
| Amazon Sponsored | Variants / campaign | 5 | 4–10 (51% of campaigns) | 4 variants to enter the mainstream |
| Google Shopping | Products / campaign | 16 | 11–50 (87% of campaigns) | 11 products to leave the thin-catalog tier |
| Meta (recent) | Ads / page (active) | 239 | Top 10k advertiser pages | Build a creative system, not just a test batch |
| Google Search | Ads / advertiser (lifetime) | 3,147 | Top 10k domains | Volume is cumulative — test consistently over time |
Source: AdSpyder Ad Library — 20,000 campaign sample (Amazon + Google Shopping) and 10,000 advertiser sample (Meta, Google Search), May 2026.
How to Benchmark Your Competitors’ Variant Count Using AdSpyder
The numbers above tell you what top advertisers do across the market. What you need is what your specific competitors are doing. Here is the exact workflow:
Open Ad Library and select your platform
Go to AdSpyder’s Ad Library. Choose the platform your competitor advertises on. Results are platform-specific — each archive is indexed separately.
Search by competitor domain, not keyword
Enter the competitor’s domain. Domain search surfaces every ad that specific advertiser has run on the chosen platform — their full creative strategy, not just ads that match a search term. Use Domain Analysis for a cross-platform view.
Filter to the last 30–90 days
Set the date filter to isolate currently running creatives. The total result count is the competitor’s current active variant stack on that platform. This removes historical noise and gives you a live benchmark.
Categorise variants by type — not just count them
As you scroll results, categorise by what is actually being tested: different hooks, price angles, image vs. video, different CTAs. What kind of variants they run matters more than the raw number. Ten near-identical ads are not ten meaningful variants.
Set up ongoing tracking so changes do not surprise you
Add competitors to an AdSpyder project to monitor their creative volume over time. Across AdSpyder’s user base, 1,104 projects actively track 3,687 competitors for exactly this reason — catching creative pivots before they show up in your own performance metrics. (AdSpyder platform data, May 2026)
Three Mistakes That Undermine Ad Variant Strategy
Mistake 1: Treating the “3 to 5 creatives” rule as an ongoing steady-state
Three to five is a reasonable floor for a single test cycle. It is not what top advertisers run at scale. 51% of Amazon campaigns run 4–10 variants and 87% of Shopping campaigns run 11–50. Staying at “3 creatives” permanently is an execution bottleneck masquerading as a strategy.
Mistake 2: Conflating volume with meaningful variation
Ten ads with the same hook, same offer, and slightly different background colours are not ten ad variants — they are one concept with ten executions. Meaningful variants test different hypotheses: a different emotional angle, a different offer structure, a different format. Volume without structure creates noise, not learning.
Mistake 3: Benchmarking against industry averages instead of direct competitors
The numbers in this blog are market-wide benchmarks. What matters is what the 3–5 brands competing for the same customers are running. Benchmark against those specific competitors — not the median of 44 million archived ads. AdSpyder lets you do that in minutes.
Ad Variant Strategy Checklist
✓
Look up your top 3 competitors in AdSpyder’s Ad Library and record their active variant count per platform — not from a benchmark table.
✓
On Amazon: confirm at least 4 variants per campaign. Below 4 puts you in the bottom quartile of active advertisers in our 10,000-campaign sample.
✓
On Google Shopping: confirm your campaign covers at least 11 products. Under 10 puts you in the 8% thin-catalog tier.
✓
On Meta: track your Facebook page’s total ad count. The median active advertiser has 239 ads on record. Measure the gap and set a quarterly production target.
✓
Categorise your variants by type: hook angle, visual format, offer, and CTA. Ten executions of the same concept do not count as ten variants.
✓
Set up ongoing competitor monitoring in AdSpyder so creative volume changes trigger a review before they show up in your performance data.
✓
Use Text Ad Generation and Image Ad Generation to accelerate variant production once you know which angles competitors are testing.
AdSpyder Ad Library
Stop guessing. Start benchmarking against what competitors actually run.
360M+ ads indexed across 10 platforms. Search any competitor, see their full creative stack, and set your variant target based on real campaign data. Used by 23,000+ marketers and agencies.
23,000+ users · 10 platforms · 360M+ ads indexed