Quick Answer
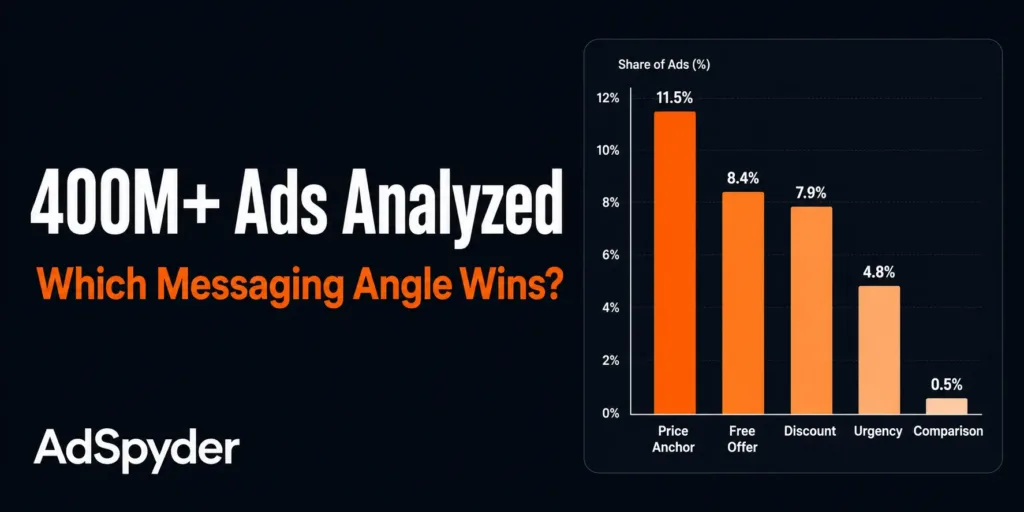
Price-anchoring is the most common ad messaging angle on the internet — appearing in 42 million of 364 million ads (11.5%) analysed by AdSpyder’s Ad Library. Free-offer language (8.4%) and discount framing (7.9%) rank second and third. Comparison-led copy is the rarest major angle at just 0.5%. Data covers Google Search, Meta, LinkedIn, YouTube, Bing, Amazon, Display and more — AdSpyder original analysis, May 2026.
Every copywriter has a list of “proven angles.” Urgency. Social proof. Fear. Curiosity. The problem is that list is almost always built on opinion — a swipe file, a course, a Twitter thread. Nobody has actually counted.
AdSpyder ran a keyword-based pattern classifier across 364 million ads on 10 platforms — Google Search, Meta (historical + real-time), LinkedIn, YouTube, Bing, Amazon, Display, Google Shopping — and counted how often each major messaging angle actually appears in real ad copy. This is what digital advertising looks like at scale, not what practitioners assume it looks like.
Three things will probably surprise you: how transactional the internet’s ad copy really is, which angle almost never appears in headlines, and which messaging approach is overrepresented in ads that keep running past 30 days.
In This Study
How We Measured This
AdSpyder ran a keyword-based pattern classifier against the title and body-copy fields of 364 million+ ads across 10 platform archives. An ad is counted under a given messaging angle if any of a curated set of keywords or phrases appears in its headline or body text. Ads can — and often do — match multiple angles simultaneously, so percentages do not sum to 100%.
Important caveat
This classifier measures keyword presence, not intent or effectiveness. An ad containing “limited time” is classified as urgency-led whether or not urgency is the primary hook. The long-running cohort analysis in Section 4 is the closest proxy to performance signal this data can provide.
Platforms excluded from angle analysis
TikTok (video-only archive; ad copy lives in voiceover, not indexed text) and Google Shopping/Amazon product titles (product naming conventions, not copywriting choices). All other platforms included.
The 11 Messaging Angles, Ranked by Frequency
364 million+ ads · 10 platforms · AdSpyder Ad Library, May 2026
#1
Price Anchor
42M ads
11.5% of all ads
#2
Free Offer
30.7M ads
8.4% of all ads
#3
Discount
29M ads
7.9% of all ads
AdSpyder platform data, May 2026
The top three angles are all transactional. Digital advertising is not aspirational by default — it’s a price-and-savings negotiation. Urgency (4.8%) and authority (3.9%) fill out the middle tier. Fear, aspiration, and comparison — the angles most copywriting courses lead with — sit at the bottom of the frequency table.
| Rank | Messaging Angle | Total Ads | % of 364M Ads | Example Phrases |
|---|---|---|---|---|
| 1 | Price Anchor | 41.9 million | 11.5% | Starting at $X, Save $X, % off, best price guarantee |
| 2 | Free Offer | 30.7 million | 8.4% | Free trial, no credit card, free shipping, instant download |
| 3 | Discount | 29.0 million | 7.9% | BOGO, Black Friday, % off sitewide, promo code |
| 4 | Urgency | 17.6 million | 4.8% | Limited time, today only, ends tonight, last chance |
| 5 | Authority | 14.1 million | 3.9% | Industry-leading, certified, trusted by professionals, #1 rated |
| 6 | Social Proof | 11.9 million | 3.3% | Trusted by X customers, 5-star reviews, best-selling, X million sold |
| 7 | Curiosity | 8.8 million | 2.4% | Did you know, discover the secret, you won’t believe |
| 8 | Benefit | 8.2 million | 2.3% | Boost your X, save time, grow your Y, increase conversion |
| 9 | Aspiration | 4.7 million | 1.3% | Transform your life, become the best version, live the life you deserve |
| 10 | Fear | 3.6 million | 1.0% | Don’t lose, protect before it’s too late, warning, avoid the trap |
| 11 | Comparison | 1.8 million | 0.5% | Better than X, instead of Y, vs the competition, stop wasting money on |
Source: AdSpyder Ad Library keyword-rule classifier, May 2026. An ad can match multiple angles.
The big takeaway: Digital advertising is overwhelmingly transactional. Price, freebies, and discounts together account for nearly 28% of the entire AdSpyder archive. Fear and aspiration — the angles most copywriting courses lead with — each appear in under 1.5% of all ads. Comparison-led copy, at 0.5%, is almost nonexistent.
How Angle Frequency Varies by Platform
The aggregate table is useful context, but the platform-level picture is what you actually need as an advertiser. The same angle performs very differently depending on where you’re running ads — and your competitors’ copy reflects that.
Google Search — 164.7 million ads
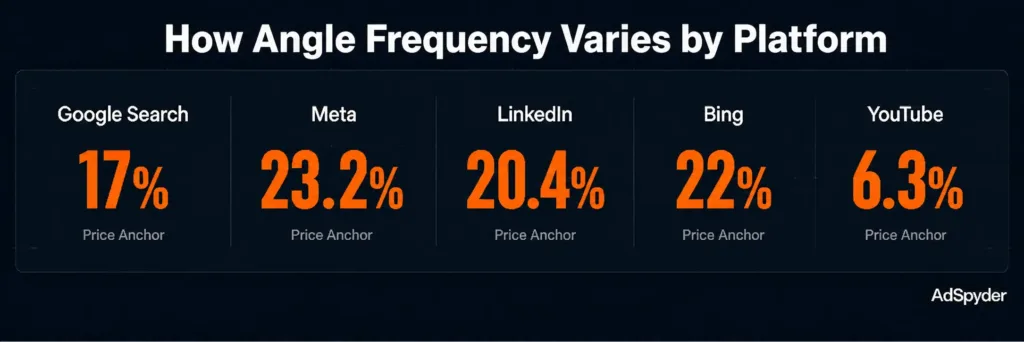
Price-anchoring leads at 17% (28M ads), followed by free-offer language at 14.1% (23.2M) and discount framing at 11.4% (18.7M). Those three angles alone cover 43% of all Google Search ad copy ever indexed. Authority cues appear in 6.9% of ads and social proof in 5.7% — both meaningfully higher than on Meta, likely because search-intent audiences are already in buying mode and respond to trust signals. Comparison-led copy sits at just 0.5% — head-to-head positioning is nearly absent even on the platform where competitor bidding is most common. You can search these patterns across AdSpyder’s Google Ads Spy.
Meta (Facebook + Instagram) — 55M ads total
The most important data point here is the gap between Meta’s historical archive (43.9M ads, 2018–2025) and the live real-time feed (11.1M active ads). Every single messaging angle is more prevalent in current ads than in the historical archive. Meta ad copy has become more emotionally intense over the past 3–4 years.
| Angle | Meta Historical (2018–2025) | Meta Real-Time (Live 2026) | Shift |
|---|---|---|---|
| Price Anchor | 16.9% | 23.2% | ↑ +6.3pp |
| Urgency | 6.9% | 13.6% | ↑ +6.7pp |
| Fear | 2.3% | 6.5% | ↑ +4.2pp |
| Aspiration | 2.5% | 7.2% | ↑ +4.7pp |
| Discount | 15.4% | 15.8% | ≈ flat |
Source: AdSpyder Meta historical archive (43.9M ads) vs Meta real-time feed (11.1M ads), May 2026
What this means: If your current Meta copy looks like it was written in 2026, it’s competing against a much more aggressive creative environment. Urgency has nearly doubled. Fear has nearly tripled. Aspiration has nearly tripled. The tactics that were once reserved for the fringes are now mainstream. Use AdSpyder’s Facebook Ads Spy to see exactly which angles your competitors are using in their current live creatives.
LinkedIn — 857,000 ads
LinkedIn is the most distinctively different platform in this dataset. Price-anchoring still leads at 20.4%, but after that the angle mix diverges sharply from every other platform: curiosity (9.4%), urgency (10.8%), aspiration (7.4%), benefit (7.4%), and authority (7.3%) all cluster together within a narrow band. Discount language sits at just 3.7% — roughly one-fifth the rate seen on retail-oriented platforms. B2B buyers don’t respond to sales the way B2C buyers do, and the LinkedIn data shows that advertisers have learned not to lead with discounts on a platform where the audience is evaluating business solutions, not shopping for deals. Explore competitor B2B copy in AdSpyder’s LinkedIn Ad Library.
Bing — 4.6 million ads
Bing has the highest combined transactional density of any platform: price-anchor (22%), free-offer (17.3%), and discount (16.1%) together cover 55% of all Bing ads. The Bing audience skews older and higher-income — but the copy they receive is more price-and-offer-driven than on any other platform in this study. Monitor competitor Bing copy using AdSpyder’s Bing Ads Spy.
YouTube — 2.5 million ads
YouTube shows the lowest angle frequencies overall — price-anchor leads at just 6.3%, authority at 4.5%. This isn’t because YouTube advertisers avoid these angles; it’s because video ad scripts carry narrative complexity that keyword-matching on text fields underestimates. The angles exist but are expressed through voiceover and storytelling rather than indexed text. Use the YouTube data as a floor, not a ceiling. Study competitor YouTube creatives directly in AdSpyder’s YouTube Ads Spy.
Which Angles Run Longest — and Which Die First
Based on 22,945 Meta historical ads split into long-running (≥30 days, n=2,131) vs short-lived (<30 days, n=20,814) · AdSpyder, May 2026
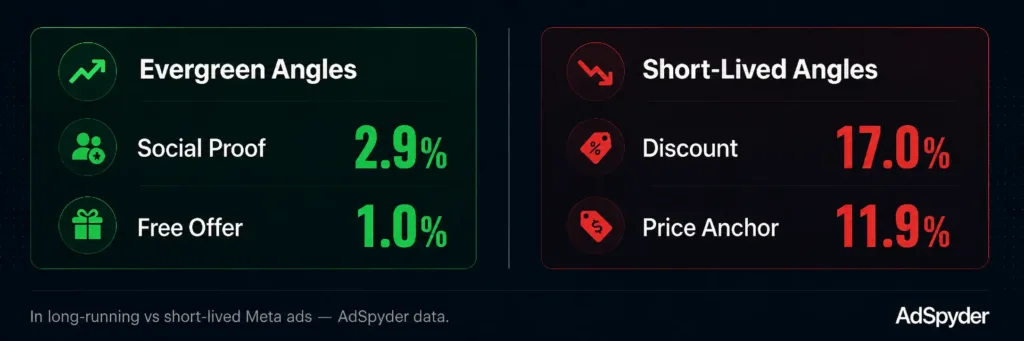
Frequency tells you what’s common. This section tells you what survives. We split 22,945 Meta historical ads into two cohorts — those still running after 30 days and those that had stopped — and measured how angle usage differed between them.
The pattern is intuitive once you see the numbers. Discount ads are tied to a sale — when the sale ends, the ad dies. Free-trial and social-proof language doesn’t expire: “trusted by 50,000 users” is as true in month 6 as it was in month 1.
| Angle | Long-Running (30+ days) | Short-Lived (<30 days) | Delta | Signal |
|---|---|---|---|---|
| Social Proof | 2.9% | 2.1% | +0.8pp | Evergreen ↑ |
| Free Offer | 1.0% | 0.6% | +0.4pp (1.7×) | Evergreen ↑ |
| Urgency | 6.6% | 6.1% | +0.5pp | Neutral |
| Discount | 12.6% | 17.0% | −4.4pp | Short-lived ↓ |
| Price Anchor | 9.7% | 11.9% | −2.2pp | Short-lived ↓ |
Source: AdSpyder Meta historical archive sample, n=22,945 ads, May 2026
The practical implication
If you want to build evergreen creative that runs for months, social proof and free-trial language are the angles most overrepresented in long-running ads. If you’re running a time-bound campaign, discount and urgency work — but don’t expect those ads to become evergreen assets.
Where Messaging Angles Actually Live: Headline vs Body Copy
Meta historical archive · 37.1M ads with headline, 35.9M with body copy · AdSpyder, May 2026
Most copywriting advice focuses on the headline. The data says that’s the wrong place to put your angle.
Across 12 messaging angles on Meta, body copy is on average 25x more likely to carry the angle keyword than the headline. The most extreme case is comparison — “better than X”, “instead of Y” — which is 57x more common in body copy than headlines. Even discount language, which IS often surfaced in headlines (“50% off”), appears in only 0.64% of Meta ad headlines but 17% of body copies.
57×
more likely to find comparison copy in body than headline
47×
more likely to find social proof in body than headline
24×
more likely to find urgency in body than headline
11×
more likely to find authority in body than headline
Source: AdSpyder Meta historical archive, May 2026
The only angle with any meaningful headline presence is authority — brand names and credential claims show up at an 11x body-to-headline ratio rather than 20–57x. Everything else — social proof, aspiration, comparison — is reserved for the body copy.
What this means for your copy: Your headline’s job is to hook attention. The angle’s job is to close the argument in the body copy below it. If you’re spending 90% of your revision time on the headline and leaving the body as an afterthought, you’re optimising the 0.28% of the ad that carries urgency signals and ignoring the 6.7%.
Messaging Angles by Industry
Meta historical archive · advertiser pageCategory field · AdSpyder, May 2026. Meta is the only platform in this archive with reliable advertiser-category metadata.
Every industry has a default angle. Knowing yours — and knowing which angle your category rarely uses — is the fastest way to find an uncrowded creative position.
Clothing & Fashion
28.3%
of ads use discount framing — the highest of any vertical. Price anchor runs alongside at 27.7%.
Urgency 9.2% · Social proof 3.6%
Real Estate
17.2%
of ads use urgency — the highest of any vertical. Open-house deadlines and inventory pressure drive this. Aspiration runs at 9.2%, 2× other verticals.
Price anchor 23.3% · Discount 15.7%
Education
10.3%
of ads use authority — the highest of any vertical. Credentials and expertise are the dominant signal. Discount sits at just 6.4%.
Urgency 15.2% · Aspiration 8.2%
Financial Services
6.2%
of ads use discount — barely half the average. Price is the topic but not “on sale.” Authority and aspiration carry more weight.
Price anchor 16.9% · Urgency 12.8%
| Industry | Dominant Angle | % Using It | Underused Angle | Opportunity |
|---|---|---|---|---|
| Clothing | Discount | 28.3% | Social proof (3.6%) | Identity, styling, community angle |
| Real estate | Urgency | 17.2% | Benefit (not measured, likely low) | Lifestyle outcome, long-term value framing |
| Education | Authority | 10.3% | Curiosity (likely low) | Discovery hooks and surprising-outcome framing |
| Financial services | Price anchor | 16.9% | Comparison (0.5% industry-wide) | Head-to-head positioning in a crowded field |
Source: AdSpyder Meta historical archive by advertiser pageCategory, May 2026
Where to find differentiation in your industry
Every vertical above has an obvious dominant angle and an obviously underused one. Clothing barely uses social proof (3.6%) despite running the highest discount volumes in the archive. Financial services barely uses comparison despite operating in one of the most competitive advertising landscapes. The angles your competitors avoid are often the ones with the lowest viewer fatigue — and the least creative competition.
What Each Angle Looks Like in Real Ads
Paraphrased patterns from the AdSpyder Meta archive — advertiser names scrubbed · May 2026
Price Anchor — 1 in 9 ads
- “Starting at $79 — lowest price in 90 days.”
- “Save up to 70%. Free shipping over $99.”
- “Tap to save $620 now.”
Social Proof — overrepresented in long-runners
- “Trusted by thousands — rated 5 stars by 3,500+ parents.”
- “#1 rated in [category] — 2,000+ five-star reviews.”
- “Over a million sold.”
Urgency — overrepresented in short-lived ads
- “LAST CHANCE! Today only — expires tonight.”
- “Flash sale: limited-time offer ends in 24 hours.”
- “Only while supplies last.”
Comparison — rarest angle at 0.5%
- “STOP wasting money on harsh box dyes. Try [product] instead!”
- “Better than the leading brand — at half the price.”
- “Unlike traditional solutions, this restores results safely.”
Fear — 1% of all ads
- “Don’t lose your savings to surprise costs — protect your home before it’s too late.”
- “Warning: most people fail to plan for this.”
- “Avoid the cost trap that destroys family assets.”
Aspiration — 1.3% of all ads
- “Imagine what your life would look like if you could achieve anything.”
- “Become the version of yourself you’ve always pictured.”
- “Live the life you deserve — start today.”
How to Use AdSpyder to Research Competitor Messaging Angles
The data above tells you what the average advertiser does. The real value is knowing what your specific competitors do — and which angles they haven’t used yet.
Search a competitor’s domain in the Ad Library
Go to AdSpyder’s Ad Library and paste your competitor’s domain. You’ll see every ad they’ve run across platforms, filterable by date range. Look at the last 90 days first — that’s their current live angle strategy.
Search for angle keywords directly
Use the angle phrases from the examples above as search queries. Try “free trial” in Facebook Ads Spy or “trusted by” in Google Ads Spy. You’ll see every ad in the archive using that angle — not just your competitors. In AdSpyder’s own usage data, “free trial” is the most-searched copy phrase by users (991 searches), ahead of “shop now” (102). Most advertisers don’t do this search — which means those who do have a research advantage.
Filter to 30-day survivors only
Sort by first-seen date and look for ads running 30+ days. Those are the ads the advertiser kept paying for. The angle in those ads is the one that’s working for them — not a test, not a failed experiment. Build your format hypothesis from the survivor cohort, not from the full archive which includes everything they’ve tried and abandoned.
Identify the angle they’re NOT using
After cataloguing your competitor’s dominant angle, cross-reference with the industry table above. If your vertical defaults to discount and your competitor runs 80% discount ads, the underused territory is social proof, benefit, or comparison. That’s your differentiation space. Check multiple platforms — use LinkedIn Ad Library, YouTube Ads Spy, and TikTok Ad Library to see if competitors run different angles on different platforms.
Generate your ad using the research as context
Once you’ve identified the angle gap, take those reference ads into AdSpyder’s Text Ad Generator or Image Ad Generator to build creative around the gap. Research before generation. In AdSpyder’s own usage data, only 14% of users who generate ads research competitor copy beforehand — meaning the 14% who do start with a significantly more informed brief.
Search 364M+ Ads by Messaging Angle
Find every competitor ad using urgency, social proof, comparison, or any other angle — across Google, Meta, LinkedIn, YouTube, Bing, and 5 more platforms. No credit card required.
23,000+ registered users · 10 platforms · 100+ countries · AdSpyder platform data, May 2026
Frequently Asked Questions
Data source: AdSpyder Ad Library — original keyword-rule classifier analysis across 364 million+ ads on 10 platform archives (Google Search, Google Shopping, Meta historical + real-time, Amazon, Bing, Display, YouTube, LinkedIn, TikTok). An ad matches a messaging angle if the relevant keyword or phrase appears in its title or body-copy text fields. Ads can match multiple angles. TikTok angle data excluded (video-only metadata).