
Quick Answer
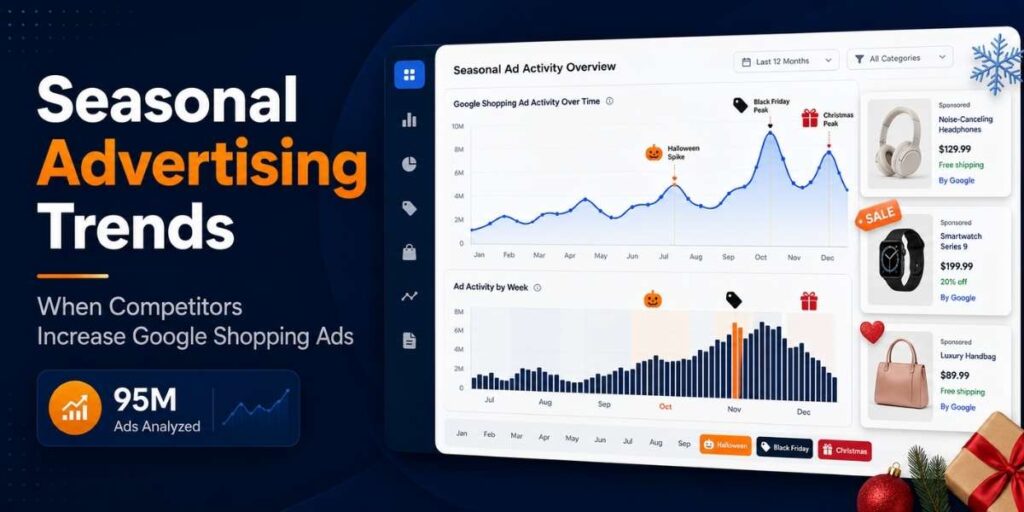
- Christmas Shopping ad activity begins building in October and peaks in December.
- Nearly 65% of Black Friday ads appeared during November itself.
- Christmas-title ad activity fell 89% from December to January.
- Different events follow different patterns: long ramps, short bursts or year-round activity with a seasonal peak.
- Ad frequency shows competitor timing—not spend, conversions or profitability.
Seasonal campaigns do not all begin at the same time. Some advertisers build demand over several months, while others activate close to the event.
AdSpyder analysed Google Shopping ad timing to identify when seasonal terms begin appearing, when activity peaks and how quickly advertisers pull back.
Marketers can use the AdSpyder Ad Library to review current and historical competitor ads before planning their own seasonal calendar.
Methodology and Dataset
The study uses AdSpyder platform data from May 2026: a Google Shopping archive containing 94.99 million ads. The analysis focuses on ads first observed during the best-covered 2021–2022 period.
Seasonal themes were identified through words in product titles, including Christmas, Halloween, Black Friday, Easter and Valentine. Their first-seen months were then compared with the event’s real calendar window.
The Shopping Ads Spy supports competitor research using product titles, images, pricing, countries and observed ad dates.
| Dataset Element | Definition |
|---|---|
| Platform | Google Shopping |
| Archive Size | 94.99 million ads |
| Primary Window | 2021–2022 coverage |
| Measurement | Seasonal title terms by first-seen month |
Executive Findings
Halloween
Share first seen in October
Black Friday
Share first seen in November
Christmas Pullback
December-to-January decline
Gift Ads
Largest seasonal title theme
Use Ad Analytics to compare active campaign presence, keyword timing and platform distribution when a seasonal movement begins appearing in your market.
Seasonal Advertising Calendar
| Theme | Ads Analysed | Peak Window | Observed Pattern |
|---|---|---|---|
| Valentine | 17,459 | January–February | Pre-event buildup |
| Easter | 26,573 | March–April | Event-window concentration |
| Halloween | 207,212 | October | Highly concentrated |
| Black Friday | 60,204 | November | Short activation burst |
| Cyber Monday | 8,553 | November–December | Later Q4 concentration |
| Christmas | 317,392 | October–December | Long ramp with December peak |
Long Ramps vs Short Bursts
Christmas Builds Over Three Months
Christmas-title ads rose from 53,924 in October to 68,602 in November and 136,594 in December.
The pattern suggests advertisers begin testing and expanding well before the final buying month.
Black Friday Activates Late
Only 2,024 Black-Friday-title ads were first observed in October, compared with 38,894 in November.
This is a concentrated activation pattern rather than a gradual multi-month build.
Cyber Monday Skews Even Later
Approximately 94% of Cyber-Monday-title ads appeared during November and December, making it one of the most tightly concentrated seasonal themes.
What Happens After the Peak?
Christmas-title activity declined from 136,594 ads in December to 15,316 in January. By February, activity was 95% below the December peak.
That pullback can create two different opportunities: stop seasonal spending quickly, or replace holiday messaging with evergreen, clearance or post-purchase campaigns.
Use Landing Page Analysis to check whether competitors change headlines, products, offers, CTAs and page layouts before and after the seasonal peak.
How to Monitor Seasonal Competitors
- Create a competitor set: Include direct brands, marketplaces and category leaders.
- Review activity monthly: Watch for new seasonal titles, images and products.
- Record the activation pattern: Classify each event as a long ramp, short burst or evergreen peak.
- Inspect the post-click journey: Compare the ad promise with the destination page.
- Build an original calendar: Use competitor timing as evidence, not as a campaign to copy.
Use URL Domain Analysis to compare an individual competitor’s visible platform activity, ads, keywords and landing-page destinations.
What Marketers Should Do Next
- Begin Christmas competitor monitoring in October.
- Prepare Black Friday assets before November even if most activity launches later.
- Use separate calendars for long-ramp and short-burst events.
- Plan the post-season message before the peak ends.
- Compare landing pages, not only ads.
- Measure results using your own spend, sales and profitability data.
Limitations and Methodology Notes
- The study measures Google Shopping ads, not lead-generation campaigns.
- First-seen timing is not guaranteed to be the exact campaign launch date.
- Seasonal title terms act as theme proxies because no structured category field was available.
- Monthly archive coverage is uneven, so total month-to-month comparisons are directional.
- The dataset does not reveal spend, impressions, clicks, conversions, revenue or profitability.
Frequently Asked Questions
When Do Competitors Start Christmas Shopping Ads?
The dataset shows a visible October buildup, stronger November activity and a December peak.
When Does Black Friday Activity Peak?
Nearly 65% of Black-Friday-title ads were first observed in November.
Do Holiday Ads Stop in January?
Christmas-title activity dropped 89% between December and January, showing a sharp post-holiday withdrawal.
Does More Ad Activity Mean Better Performance?
No. Activity shows timing and competitive presence. Performance must be measured using your own campaign, sales, and revenue data.
Turn Seasonal Patterns Into Controlled Campaign Actions
Set budget rules, observation windows, attribution lag, and rollback limits before increasing your own seasonal campaign activity.