
Quick Answer
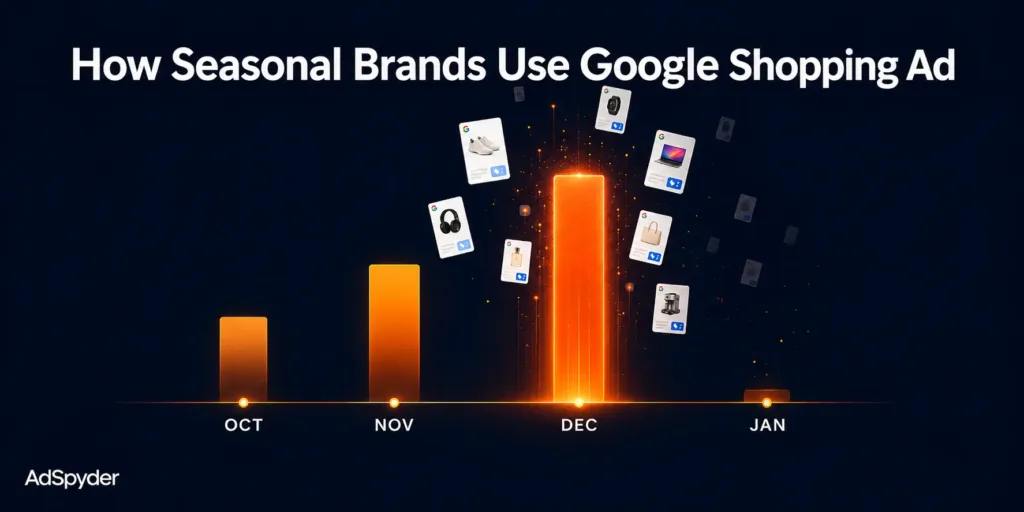
Seasonal Google Shopping ads follow two distinct patterns: Christmas is a slow 3-month ramp (October → December), while Black Friday is a tight, late-November burst. AdSpyder’s analysis of 94.99 million Google Shopping ads shows that 63% of Halloween ads land in October, 65% of Black Friday ads land in November, and Christmas ad activity drops 89% from December to January. Use AdSpyder’s Shopping Ads Spy to track when competitors activate seasonal campaigns, which products they push, and when they go dark — before your season starts. Source: AdSpyder platform data, May 2026.
Most seasonal strategy guides tell you to “start early and watch competitors.” What they don’t tell you is what competitor monitoring actually looks like in a Google Shopping context — which ads went live, for which products, and when they were pulled.
That information isn’t in your auction insights report. It’s in the ad archive. This guide is built on AdSpyder’s analysis of 94.99 million Google Shopping ads (2022–2026 archive). You’ll get the exact seasonal timing patterns competitors follow, what the data reveals about activation and pullback, and a step-by-step workflow to apply it before your next seasonal campaign.
In This Article
The Seasonal Ad Clock: What 94 Million Shopping Ads Reveal
AdSpyder Google Shopping archive — seasonal title-term timing, 94.99M ads · May 2026
The most important question for any seasonal brand isn’t “when should I launch?” — it’s “when do my competitors launch?” AdSpyder’s Google Shopping archive gives a data-backed answer.
Seasonal ad activity clusters precisely in its true calendar window. Halloween terms peak in October. Black Friday in November. Christmas ramps across three months. The timing signal is genuine — which makes it directly usable for competitor intelligence.
63%
of Halloween Shopping ads appear in October
131k of 207k Halloween-title ads
65%
of Black Friday Shopping ads appear in November
38.9k of 60k Black-Friday-title ads
94%
of Cyber Monday ads land in November–December
the most Q4-concentrated term in the archive
43%
of Christmas ads peak in December
after a steady 3-month ramp from October
Source: AdSpyder platform data, May 2026. Google Shopping archive, 94.99M ads, 2021–2025 coverage. Seasonal title-term timing validated against calendar months.
| Season / Event | Peak Month(s) | Total Ads in Archive | Concentration |
|---|---|---|---|
| Gift / Gifts | December (203k peak) | 988,000+ | Year-round; Dec-peaked |
| Valentine’s Day | January–February | 17,459 | 44% in Jan/Feb |
| Easter | March–April | 26,573 | 42% in Mar/Apr |
| Mother’s Day | March–May | 28,753 | Pre-event buildup |
| Summer | March–June | 224,297 | Spread across Q2 |
| Halloween | October | 207,212 | 63% in October — most concentrated |
| Thanksgiving | October–November | 6,504 | 39% in November |
| Black Friday | November | 60,204 | 65% in November |
| Cyber Monday | November–December | 8,553 | 94% in Q4 |
| Christmas / Xmas | October → December ramp | 317,392 | 43% in December; ramp starts Oct |
Source: AdSpyder platform data, May 2026. Google Shopping archive, 94.99M ads, 2021–2025 coverage.
Two Activation Patterns — and Why They Need Different Intelligence Strategies
Activation & pullback timing · AdSpyder Google Shopping archive, May 2026
Not all seasonal competitors behave the same way. The data reveals two structurally different patterns. Knowing which one applies to your market determines how much lead time you actually have — and how to respond.
Pattern A — The Slow Build (Christmas)
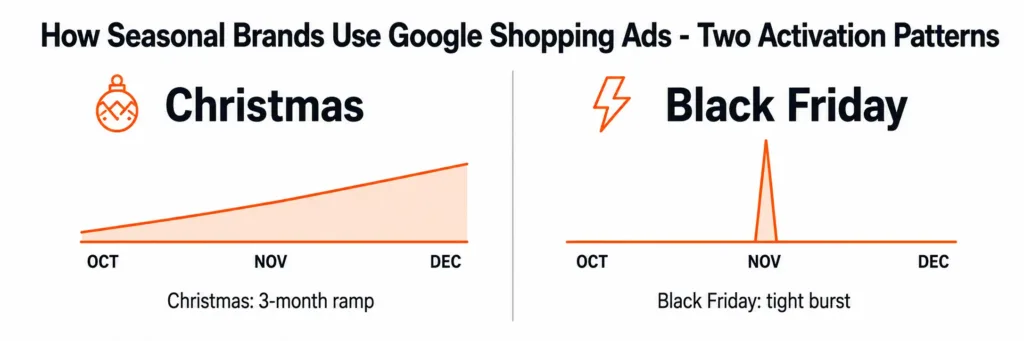
Christmas Shopping ads follow a predictable 3-month ramp. In AdSpyder’s archive, Christmas-titled ads more than doubled from October (54k) to November (69k) to December (137k) — a steady climb with the strongest acceleration in December.
Intelligence implication: You have an 8–10 week window to observe competitor seasonal Shopping activity before peak. If you’re not watching in October, you’re already behind the market.
Pattern B — The Tight Burst (Black Friday)
Black Friday operates completely differently. 65% of Black Friday–titled Shopping ads appeared in November itself — only 3% launched in October. Unlike Christmas, competitors don’t warm up slowly. They activate hard and late, right at the event window.
Intelligence implication: Watching Black Friday competitors in September is pointless. Your signal window is tight — watch for the burst in early November and be ready to respond within days, not weeks.
54k → 137k
Christmas Shopping ads
October to December — a 2.5× increase during the ramp
Only 3%
of Black Friday ads launched in October
vs. 65% appearing in November itself
12.4M
Shopping ads first seen in December 2021
the single largest month in the entire archive
Source: AdSpyder platform data, May 2026. Google Shopping archive, 94.99M ads, 2021–2025 coverage. Raw monthly volume is directional due to crawl-coverage gaps.
The January Cliff: When Competitors Go Dark
Christmas-title ad pullback · AdSpyder Google Shopping archive, May 2026
Knowing when competitors stop advertising is as valuable as knowing when they start. And in the Google Shopping data, the post-Christmas pullback is the starkest signal in the archive.
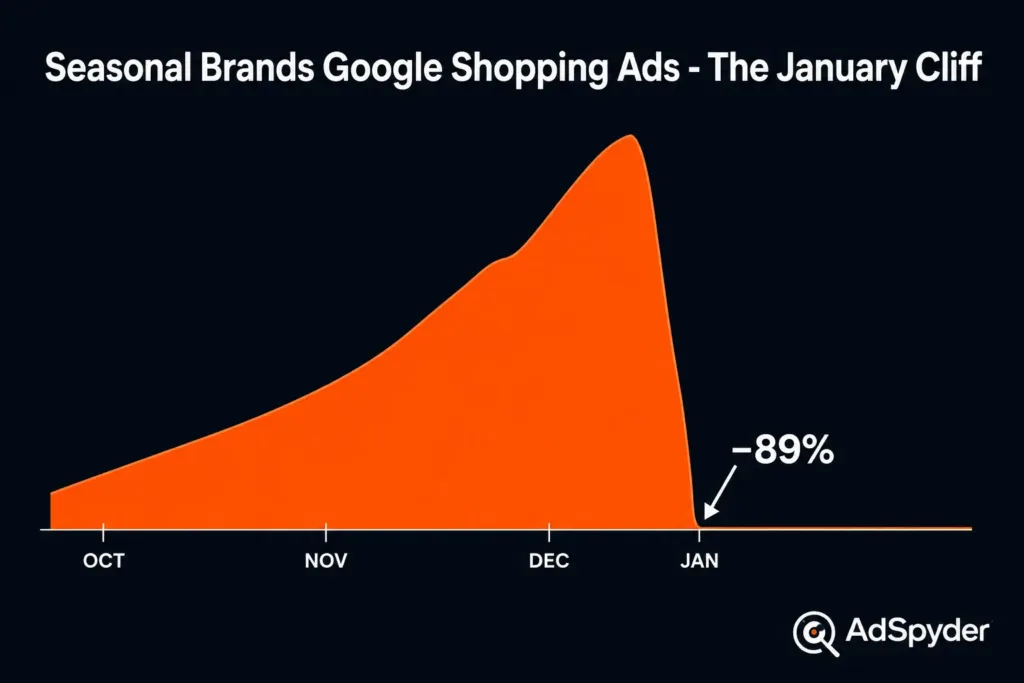
89%
Drop in Christmas Shopping ad activity: December → January
137k Christmas-titled ads in December → 15k in January. By February, activity is down 95% from the December peak.
Source: AdSpyder platform data, May 2026. Google Shopping archive, 94.99M ads, 2022–2025 coverage.
This means roughly 9 in 10 brands running Christmas Shopping ads vanish from the auction in January. For brands that stay live — with post-holiday clearance, New Year gifting angles, or gift-card redemption copy — January becomes a near-empty auction with dramatically lower competition for the same shopper intent.
Tip: The January Opportunity
Use AdSpyder’s Shopping Ads Spy to track how many competitor domains are still running Shopping ads in the first two weeks of January. If you see a sharp pullback in your category, hold or slightly increase budget — you’ll own remaining post-holiday demand with far less competition.
Who Actually Dominates Seasonal Google Shopping Ads?
Christmas-title retailer & country breakdown · AdSpyder Google Shopping archive sample, May 2026
The archive also reveals which retailers dominate seasonal Shopping ads — and the answer tells you something important about category strategy. In a sample of Christmas-titled Shopping ads, Etsy was the single most active retailer by a wide margin — driven by handmade and personalised gifting. Large global marketplaces (Amazon across .com, .co.uk, .ca, .in; eBay; Lazada; Walmart; AliExpress) and print-on-demand players like TeePublic made up the rest of the top tier.
What this tells brand advertisers
Etsy’s dominance confirms that handmade and personalised gifting is the most heavily-advertised Christmas Shopping category. If your products compete in gifts, home décor, or personalised items, you’re in the most contested seasonal segment. This helps you anticipate which product types will crowd the Christmas Shopping results — and where bids need to be strongest.
Geographically, Christmas Shopping advertising is overwhelmingly a Western, English-speaking market. The US (43%), UK (24%), Canada (8%), and Australia (7%) account for 82% of all Christmas-titled Shopping ads in the archive. This makes country filtering essential when building a seasonal competitive analysis — the competitor landscape looks very different by market.
| Country | Share of Christmas Shopping Ads | Ad Count (archive sample) |
|---|---|---|
| United States | 43% | 136,076 |
| United Kingdom | 24% | 75,710 |
| Canada | 8.3% | 26,198 |
| Australia | 7.3% | 23,202 |
| Philippines | 2.5% | 8,018 |
| India | 2.4% | 7,526 |
Source: AdSpyder platform data, May 2026. Christmas-title ads by country. Country share is influenced by overall archive coverage mix.
See Your Competitors’ Seasonal Shopping Strategy — Before They Run It
AdSpyder indexes 94 million+ Google Shopping ads. Filter by domain, keyword, or season to track competitor activation patterns in real time.
How to Use AdSpyder’s Shopping Ads Spy for Seasonal Competitor Intelligence
A repeatable workflow for seasonal e-commerce brands and retail PPC managers
Each step below surfaces a specific type of intelligence that isn’t available in Google’s native tools. Run through this 6–8 weeks before any major seasonal window.
Search a competitor domain in Shopping Ads Spy
Go to adspyder.io/shopping-ads-spy and enter a competitor’s domain. Pull up their full Shopping ad history. At this stage you’re not reading individual ads — you’re mapping when their ad volume spikes. A competitor with a consistent Shopping surge starting in October is running a Christmas slow-build strategy.
Filter by seasonal keyword terms
Filter by title terms — “Christmas,” “Black Friday,” “gift,” “Halloween,” “winter,” “festive” — to see exactly which products a competitor promotes under each seasonal theme. Cross this with the activation timing: if their Christmas ads carry specific product titles starting in October, those are the categories they’re prioritising. You now know what to match or undercut.
Classify each competitor’s activation pattern
Based on what you see, classify each competitor: slow-builder (Christmas ramp) or burst activator (Black Friday style). Slow-builders give you 8–10 weeks of advance intelligence. Burst activators give you days. Knowing the pattern type changes your entire response strategy — you either prepare methodically or keep a rapid-response budget ready.
Watch for the pullback signal
Use URL & Domain Analysis to monitor competitor Shopping activity going into January. When you see their seasonal ad count collapse — the 89% December-to-January drop is the market-wide average — note whether specific competitors pull back harder or hold. The ones that hold are signalling confidence in post-holiday demand. That’s a product or category signal.
Cross-check Search co-activation on the same domain
Sophisticated competitors run Shopping and Search together at peak. After checking Shopping ad timing, cross-check the same domain in Google Ads Spy to see whether their search copy carries matching seasonal terms at the same time. If both channels activate together, their budget commitment is high — you need to match it or find a gap they’re ignoring.
Build your seasonal response calendar
Map your findings into a 12-month competitor intelligence calendar. Mark when each major competitor historically activates each seasonal theme. Use prior-year patterns as the baseline expectation and monitor for deviations — a competitor activating 3 weeks earlier than usual signals they’re scaling up or testing a new product push.
Manual Monitoring vs. AdSpyder Shopping Ads Spy
Most PPC managers attempt seasonal competitor monitoring using Auction Insights and manual searches. Here’s what each actually gives you.
| Capability | Manual / Auction Insights | AdSpyder Shopping Ads Spy |
|---|---|---|
| Historical ad archive | ❌ Current window only — no history | ✅ 94M+ ads; data from 2018 onwards |
| Competitor activation timing | ❌ Shows impression share, not timing | ✅ Filter by first-seen date to map activation curves |
| Product-level competitor ads | ❌ No product titles or images visible | ✅ See exact product titles, images, prices, domains |
| Seasonal keyword filtering | ❌ Not available | ✅ Filter by title terms (Christmas, Black Friday, gift, etc.) |
| Pullback / dark period detection | ❌ No | ✅ Track when competitor domains reduce Shopping activity |
| Cross-channel co-activation | ❌ Single channel only | ✅ Cross-check same domain across Shopping + Search + Display |
| Multi-domain monitoring | ⚠️ Limited to domains bidding your keywords | ✅ Search any domain — including aspirational competitors |
| Country-level filtering | ⚠️ Restricted to your own campaign markets | ✅ 100+ countries covered — compare markets side by side |
4 Seasonal Shopping Ad Intelligence Mistakes to Avoid
❌ Applying Black Friday logic to Christmas planning
These are two structurally different competitive events. Black Friday competitors activate late and hard. Christmas competitors ramp for 3 months. Using November’s Black Friday auction data to predict December Christmas competition will give you the wrong signals and the wrong timing.
❌ Going dark in January because everyone else does
The 89% December–January pullback is a market clearing. Brands that plan a January presence — with clearance stock, gift redemption copy (“received a gift card?”), or New Year framing — face a near-empty competitive landscape. Following the crowd in January means leaving post-holiday ROAS on the table.
❌ Monitoring only competitors who appear in your auction
Auction Insights only shows competitors appearing in your auctions. Seasonal competition in Shopping often comes from category-adjacent brands — a gifting competitor targeting “Christmas home décor” may not appear in your “Christmas ornaments” auction until they shift budget mid-season. Use AdSpyder to monitor proactively, not reactively.
❌ Treating “gift” as a purely Christmas signal
With 988,000 “gift” ads in the archive and a December peak of 203k, “gift” is a year-round, high-volume category. Easter, Mother’s Day, Valentine’s Day, and summer all generate significant gift-focused Shopping activity. Build seasonal strategies for each gifting moment separately — not a single “gifting season” push that misses 10 months of demand.
Pre-Season Competitor Intelligence Checklist
Run through this 6–8 weeks before each major seasonal window. It takes under an hour in AdSpyder and prevents the most common reactive mistakes.
Frequently Asked Questions
Plan Your Seasonal Shopping Campaign With Real Competitor Data
94 million+ Google Shopping ads indexed. See when competitors activate seasonal campaigns, which products they push, where they advertise, and when they pull back — before your season starts.
23,000+ registered users · 10 platforms · 100+ countries · AdSpyder platform data, May 2026
Data source: AdSpyder Google Shopping ads archive — 94.99M ads, first-seen dates spanning 2018–2021 (well-covered window: 2021–2025). Seasonality validation based on within-term timing distributions (seasonal title terms vs. calendar month of first-seen date). Raw monthly volume figures are directional — August and September show crawl-coverage gaps and are not cited as zero-demand periods. All figures: AdSpyder platform data, May 2026.