
Quick Answer
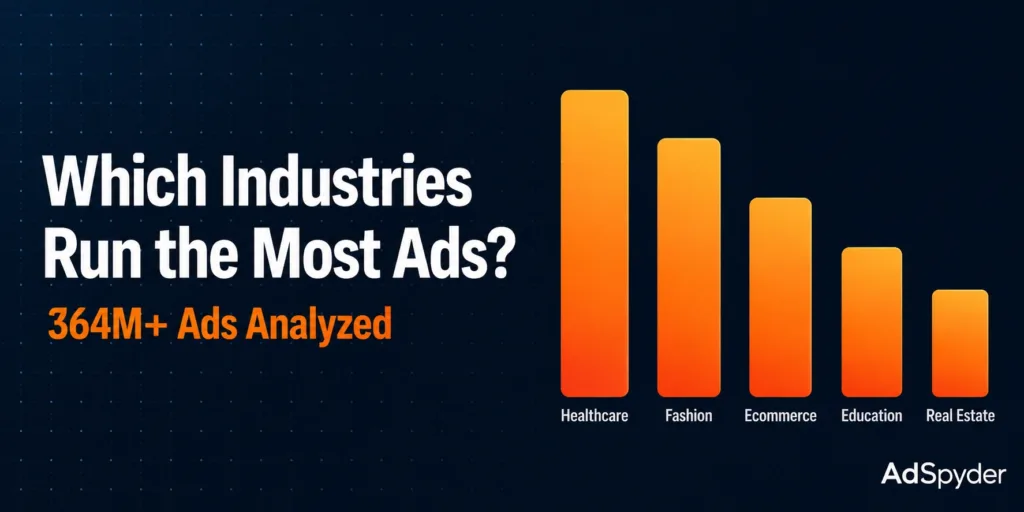
Based on AdSpyder’s analysis of 364M+ real ads across 10 platforms, ecommerce and marketplaces run the most ads globally. On Google Search, Amazon alone accounts for ~5 million ads. On Meta, Business & Local Services leads with 1.06M ads, followed by Healthcare & Beauty (917k), Ecommerce (533k), Publishing & Media (518k), and Fashion & Apparel (458k). This is ad volume data — actual indexed creatives across 150+ countries — not projected spend. Source: AdSpyder platform data, May 2026.
Most “ad spend by industry” reports tell you how many dollars each sector is projected to spend. They’re built from financial filings, surveys, and analyst estimates — and they can’t tell you which industries are actually running the most ads right now, on which platforms, or in which countries.
This report is different. AdSpyder indexed 364 million+ real ad creatives across Google Search, Meta, Amazon, YouTube, LinkedIn, TikTok, Bing, Display, and Google Shopping — then measured which industries dominate each platform by actual ad count, across 150+ countries.
No projections. No surveys. Just the ads themselves — who’s running them, where, and in what format. This data is not available anywhere else.
In This Report
Data & Methodology
All numbers in this report come from AdSpyder’s ad archive (May 2026). The dataset covers 364 million+ indexed ad creatives across 10 platforms. “Ad count” means total indexed creatives, not impressions or media spend.
Important note on industry classification
Meta is the only platform that tags advertisers with a structured industry category (its pageCategory field). For all other platforms — Google Search, Amazon, Bing, YouTube, LinkedIn — there is no platform-level industry tag. We group top advertiser domains into broad verticals as a proxy. Those groupings are clearly labelled throughout this report.
Ad volume ≠ ad spend
A sector can run many low-budget creative tests while another runs fewer campaigns with much larger media budgets. Ad volume is the best publicly-measurable signal of competitive activity intensity — not a direct measure of dollars spent.
Top Industries by Ad Volume on Meta (Facebook & Instagram)
43.9 million Meta ads · advertiser pageCategory field · AdSpyder Ad Library, May 2026
Meta is the strongest source for structured industry analysis because its advertiser pages carry a category label. The numbers below group Meta’s raw category labels (like health/beauty, clothing (brand), financial service) into broader verticals for readability.
#1
Business & Local Services
1.06M ads
178,409 distinct advertisers
#2
Healthcare & Beauty
917k ads
67,306 distinct advertisers
#3
Ecommerce & Marketplaces
533k ads
49,965 distinct advertisers
Source: AdSpyder Meta (Facebook & Instagram) Ads archive, pageCategory analysis, May 2026.
| Rank | Industry Vertical | Total Ads | Distinct Advertisers | Raw Meta Labels |
|---|---|---|---|---|
| 1 | Business & Local Services | 1,057,879 | 178,409 | business, local business |
| 2 | Healthcare & Beauty | 916,651 | 67,306 | health/beauty, health & wellness website, medical service |
| 3 | Ecommerce & Marketplaces | 532,964 | 49,965 | shopping, retail company |
| 4 | Publishing & Media | 518,450 | 14,907 | book, media/news company |
| 5 | Fashion & Apparel | 458,426 | 43,729 | clothing (brand), jewelry/watches |
| 6 | Education & EdTech | 409,222 | 20,730 | education, education website, school |
| 7 | Creator Economy | 384,256 | 34,185+ | digital creator, public figure, entrepreneur |
| 8 | SaaS & Productivity | 352,489 | 25,700+ | internet company, app page, software |
| 9 | Real Estate | 315,297 | 74,570 | real estate |
| 10 | Finance & Insurance | 208,957 | 29,255 | financial service |
Source: AdSpyder Meta (Facebook & Instagram) Ads archive — advertiser pageCategory analysis, May 2026. 43.9M total ads. Meta’s pageCategory field is populated on a subset of historical ads; counts represent a confirmed floor, not a ceiling.
What this means for agencies: On Meta, B2C verticals dominate the top 5 — business services, healthcare/beauty, fashion, ecommerce, publishing. Finance and SaaS are both below rank 8. Those industries are not underadvertising; they’re spending on Google Search and LinkedIn instead. Don’t benchmark a SaaS client against a healthcare brand’s Meta volume.
Explore What Your Industry Competitors Are Running Right Now
Search 364M+ ads across Google, Meta, Amazon, YouTube, LinkedIn, TikTok and more. Filter by domain, keyword, country, platform, and date range.
Top Industries on Google Search Ads
164.7 million Google Search ads · top advertiser domain analysis · AdSpyder Ad Library, May 2026
Google Search doesn’t carry a structured advertiser-industry field. We ranked the top advertiser domains in AdSpyder’s 164.7 million Google Search ad archive, excluded Google’s own redirect domains (googleadservices.com, google.com) and lead-gen aggregators, then grouped the remaining advertisers into verticals.
The result is unambiguous. E-commerce dominates paid search by a wide margin.
| Industry | Est. Share of Top 50 | Key Advertisers (domain) |
|---|---|---|
| Ecommerce & Marketplaces | ~50% | Amazon (8 TLDs, ~5M ads), MercadoLibre, Trendyol, Etsy, eBay, Alibaba, Wayfair, Flipkart |
| Travel & Hospitality | ~12% | Booking.com (1.16M ads), Agoda (329k), Expedia (265k), Viator (170k) |
| SaaS & Productivity | ~10% | Udemy (469k), Canva (223k), Adobe (199k), Grammarly (187k), Fiverr (155k) |
| Streaming & Entertainment | ~6% | Disney+ (209k), Prime Video (196k), Paramount+ (175k), HBO Max (158k) |
| Fashion & Apparel | ~6% | ASOS (425k), Nike (264k), Farfetch (172k) |
Source: AdSpyder Google Search Ads archive — top advertiser domain analysis, May 2026. Industry groupings are domain-to-vertical mapping, not platform-tagged classification.
The streaming industry surprise
Disney+, Prime Video, Paramount+, and HBO Max together account for ~737k indexed Google Search ads. Four entertainment brands sit in the same ad-volume tier as Canva and Grammarly. Streaming is one of the heaviest Google Search industries — yet most competitive intelligence guides don’t include it.
Shopping channels add another layer. AdSpyder’s Google Shopping Ads archive indexes 94.9M product ads and the Amazon archive holds 21.2M Sponsored Ads. Together that’s over 116M product-led ad records — a separate, entirely ecommerce-dominated channel on top of paid search.
On Amazon specifically, the top brand categories are apparel and footwear — Nike, Adidas, Levi’s, SHEIN, Puma and Reebok all appear in the top 15 by brand-level ad count. Fashion dominates Amazon ads in a way it doesn’t on Google Search.

Which Countries Run the Most Digital Ads?
Country-of-impression metadata across all platform archives · AdSpyder Ad Library, May 2026
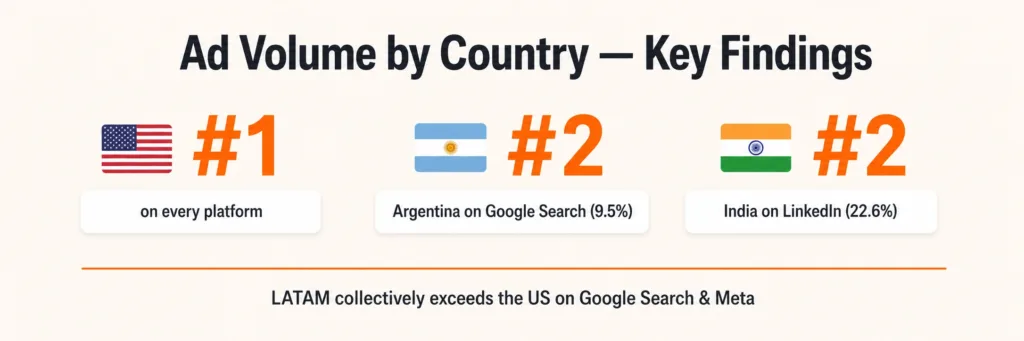
AdSpyder’s archive spans ads from 268 distinct countries on Google Search alone. The US, India, and UK appear in the top 5 on every platform. But the most important finding is one almost no industry report covers: Latin America’s ad volume is massive.
Argentina is the #2 country on Google Search with 15.7 million ads — 9.5% of the entire archive, just behind the US at 16.3%. LATAM collectively (Argentina, Brazil, Mexico, Chile, Peru, Colombia) exceeds the US share on both Google Search and Meta.
| Country | Google Search | Google Shopping | Meta (Hist.) | Amazon | |
|---|---|---|---|---|---|
| 🇺🇸 United States | #1 · 16.3% | #1 · 22.1% | #1 · 11.3% | #1 · 51.9% | #1 · 33.8% |
| 🇦🇷 Argentina | #2 · 9.5% ↑ | #10 · 3.2% | #7 · 3.5% | — | — |
| 🇮🇳 India | #3 · 7.9% | #3 · 6.4% | #3 · 4.9% | #2 · 20.8% | #2 · 22.6% ↑ |
| 🇹🇷 Turkey | #4 · 6.2% | — | — | — | — |
| 🇬🇧 United Kingdom | #5 · 5.4% | #2 · 10.7% | #10 · 2.9% | #3 · 13.8% | #3 · 12.1% |
| 🇧🇷 Brazil | #6 · 5.3% | #6 · 4.6% | #5 · 4.1% | — | — |
| 🇲🇽 Mexico | #8 · 4.6% | #4 · 5.9% | #2 · 8.4% ↑ | — | — |
Source: AdSpyder Ad Library — country-of-impression metadata, May 2026. “—” = not in platform top 10 or data unavailable. ↑ = notably higher rank than expected.
India’s B2B advertising presence
India is #2 on LinkedIn ads at 22.6% — just behind the US at 33.8% and well ahead of the UK (12.1%). If your B2B brand isn’t running LinkedIn ads targeting India, you are absent from one of the platform’s two largest audiences. Explore LinkedIn ad activity by country in AdSpyder.
Creative Format Changes by Industry
Meta historical archive · image and video flag analysis across 43.9M ads · AdSpyder, May 2026
High ad volume alone doesn’t tell the whole story. Each industry has a dominant format — and going against that default is either a deliberate differentiation move or a budget misallocation. The data below tells you which is the industry norm.
| Industry | Video % | Image % | Creative Lean |
|---|---|---|---|
| Publishing & Media (Books) | 74.3% | 25.8% | VIDEO-HEAVY |
| Healthcare & Beauty | 54.3% | 46.9% | Slight video lean |
| Ecommerce & Marketplaces | 48.7% | 52.4% | Balanced |
| Education & EdTech | 46.8% | 54.2% | Slight image lean |
| Finance & Insurance | 36.8% | 65.0% | Image-heavy |
| Fashion & Apparel | 35.8% | 65.5% | Image-heavy |
| Consumer Electronics | 39.4% | 61.5% | Image-heavy |
| Real Estate | 33.5% | 67.6% | IMAGE-HEAVY |
Source: AdSpyder Meta historical archive — pageCategory × image/video flag analysis, May 2026.
The practical implication: if you’re a finance advertiser running video-first creative on Meta, you’re going against what 65% of your industry does by default. Use the AdSpyder Facebook Ads Spy to check whether your direct competitors match the industry benchmark, then decide whether to follow or break from it.
Ad Intensity: How Many Ads Does Each Industry Run Per Advertiser?
Meta historical archive · distinct pageId per pageCategory · AdSpyder, May 2026
Total ad count shows which industries generate the most volume. Ads per advertiser shows how intensively each individual participant in that industry advertises. The gap between them reveals two completely different competitive structures.
51.3
Publishing & Media
avg ads per advertiser — the highest intensity of any Meta vertical. 5,751 advertisers, 295k ads.
26.9
Retail & Ecommerce
avg ads per advertiser. Retailers run many product, offer, and seasonal creative variants.
4.2
Real Estate
avg ads per advertiser. 74,570 distinct agents and firms, each with a tiny footprint.
Source: AdSpyder Meta historical archive, May 2026.
| Industry | Total Ads | Distinct Advertisers | Avg Ads / Advertiser | Structure |
|---|---|---|---|---|
| Publishing & Media | 294,896 | 5,751 | 51.3 | Concentrated |
| Retail & Ecommerce | 155,230 | 5,776 | 26.9 | Concentrated |
| Fashion & Apparel | 359,853 | 43,729 | 8.2 | Mixed |
| Finance & Insurance | 208,957 | 29,255 | 7.1 | Mixed |
| Healthcare & Beauty | 916,651 | 67,306 | 5.9 | Fragmented |
| Business & Local Services | 1,057,879 | 178,409 | 5.1 | Fragmented |
| Real Estate | 315,297 | 74,570 | 4.2 | Most Fragmented |
Source: AdSpyder Meta historical archive — pageCategory × distinct pageId analysis, May 2026.
In a fragmented industry like real estate, a small team running 15–20 well-targeted ads can stand out because most competitors only run 4. In publishing or retail, where the benchmark is 27–51 ads per advertiser, creative volume is the competitive baseline — you need it just to be visible.
Industries That Punch Above Their Weight
Some verticals have ad volume disproportionate to their economic size. Others are far smaller than you’d expect given their industry revenue. Here’s what the data actually shows.
📚 Publishing — The Most Intense Vertical
Book publishers run 51 ads per advertiser — the highest ratio of any Meta category, despite being a relatively small industry by revenue. Every book launch generates dozens of creative variants across audiences, hooks, and formats. If you’re in publishing and not testing at this cadence, you’re below the category baseline.
🎓 Indian Education & EdTech — The Most Under-Reported Story
Education ads on Meta are 40x more common in India than in the US (where both country and category fields are populated). Udemy has 469,000 indexed Google Search ads — one of the top 15 advertisers in the entire 164.7M-ad archive. Domestika runs 342,000 Meta ads. Mindvalley is currently in the live Meta top 30 with 11,864 active ads. Indian EdTech is one of the most aggressive advertising categories anywhere.
🏠 Real Estate — The Widest Long Tail
Real estate has 74,570 distinct advertisers on Meta — more than any other category — yet each runs just 4.2 ads on average. The cumulative volume (315k ads) is large, but no single player dominates. Real estate is one of the few industries where a well-resourced individual advertiser can genuinely become the most visible player in a regional market.
🤖 Generative AI Tools — The 2026 New Entrant
ChatGPT currently sits at #27 on AdSpyder’s live Meta feed with 4,606 active ads — the same volume tier as Booking.com and Farfetch. Shopify is #14 (7,031 ads), TikTok for Business is #13 (7,571 ads). Generative-AI tools have entered the same advertising-volume league as established global consumer brands. This is a 2026 development.
💰 Finance & SaaS — Conspicuously Small on Meta
Finance generates only 209k Meta ads and SaaS only 352k — well below healthcare (917k) or fashion (458k), despite both being trillion-dollar industries. These categories aren’t underadvertising. They over-index on Google Search and LinkedIn — intent-driven, professionally-targeted platforms that fit their buying cycles better than social.
Who’s Running the Most Ads Right Now?
AdSpyder Meta real-time feed — rolling 30-90 day live window · May 2026
AdSpyder’s Meta real-time feed captures the live rolling window of active Facebook and Instagram ads. The top 5 advertisers by active ad count right now:
12,677
Myntra
Fashion · #1
11,864
Mindvalley
Education · #2
10,603
Flipkart
Ecommerce · #4
9,585
Indira IVF
Healthcare · #6
4,606
ChatGPT
AI Tools · #27
Source: AdSpyder Meta real-time feed (rolling 30-90 day window), May 2026.
Three things stand out. First, Indian brands dominate the live top 10 — Myntra, Flipkart, Indira IVF, JioMart, and Swiggy Instamart all appear. Second, food delivery is now a major advertising category — Uber Eats (#19), Pizza Hut (#20), and Swiggy Instamart (#22) are all running 5,500–5,800 active ads. Third, generative-AI tools have arrived — ChatGPT at #27 is in the same tier as established travel and fashion brands.
You can see the current live ad activity for any brand in AdSpyder’s Facebook Ads Spy or Instagram Ads Spy.
How to Use This Data in Your Own Industry Research
The rankings above give you the macro picture. Here is how to go from industry data to specific competitive intelligence using AdSpyder.
Search your competitor’s domain
Go to the AdSpyder Ad Library and enter your top competitor’s domain. Filter by platform and date range. You’ll see every ad they’ve run that AdSpyder has indexed — headlines, creatives, durations, countries targeted. For landing page strategy alongside ad volume, use URL & Domain Analysis.
Find what’s actually working — look at ad longevity
Sort by first-seen date and identify ads running 30+ days. Across AdSpyder’s archive, only 8–40% of ads survive past 30 days depending on platform and format. An ad a competitor has run for 60+ days is almost certainly profitable — that’s the creative worth studying for angle, format, and headline structure.
Compare format against your industry benchmark
Use the format benchmarks from this report. If your industry runs 65% image and your competitor is running 70% video, check how long those video ads have been running. Long-running = working. Short-lived = test they abandoned. Cross-reference using Google Ads Spy and YouTube Ads Spy to see the same brand’s behaviour across channels.
Set up ongoing competitor tracking
One-off searches show you a snapshot. AdSpyder users currently track 3,687 competitors across 1,104 active projects — getting rolling updates on ad count, estimated CPC, and keyword changes. Once you’ve mapped your competitive landscape, add the key players to a project so you stop missing new launches.
Find the Most Active Advertisers in Your Industry
Search 364M+ ads across Google, Meta, Amazon, YouTube, LinkedIn, TikTok and more. Filter by domain, keyword, country, platform, and date range. No credit card required.
23,000+ registered users · 10 platforms · 150+ countries · AdSpyder platform data, May 2026
Mistakes to Avoid When Reading Industry Ad Data
Treating ad volume as exact spend
Ad volume shows competitive activity, not media budget. Use it as an intensity signal, not a confirmed spend figure.
Comparing industries across platforms without adjusting
Finance’s low Meta volume isn’t weakness — it’s channel preference. Always compare platform to platform, not industry to industry across platforms.
Using one universal benchmark for all clients
A real estate advertiser needs to be measured against 4.2 ads per advertiser. A fashion retailer’s benchmark is 8.2. The same number means different things in different verticals.
Frequently Asked Questions
Data source: AdSpyder Ad Library — original analysis across 364M+ ads on 10 platform archives (Google Search, Google Shopping, Meta Facebook + Instagram historical + real-time, Amazon, Bing, Display, YouTube, LinkedIn, TikTok). Industry classification uses Meta’s native pageCategory field for Meta-specific tables; top-domain proxy grouping for Google Search and Amazon. All counts are indexed ad creatives, not impressions or spend. AdSpyder platform data.