Quick Answer
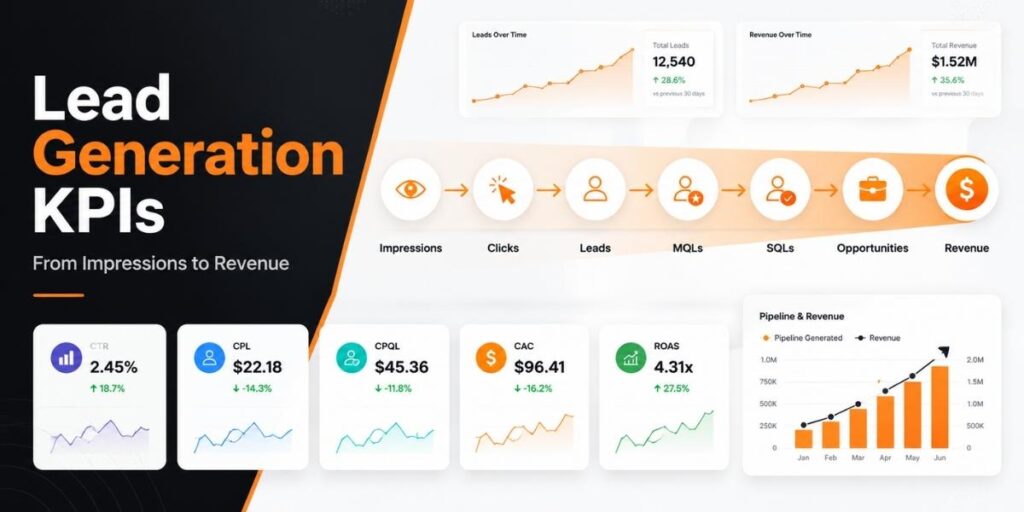
- Track the complete path from impression to click, lead, qualified lead, opportunity, customer and revenue.
- Use CTR, CPC and landing-page conversion rate to diagnose campaign friction.
- Use CPQL, cost per SQL and opportunity rate to measure lead quality.
- Use CAC, revenue ROAS and profit-based ROI to evaluate commercial results.
- Define MQL, SQL, opportunity and customer stages before calculating conversion rates.
- Never treat pipeline value as completed revenue or raw leads as qualified demand.
A campaign can generate a low cost per lead and still fail to create useful pipeline. Another campaign can look expensive at the lead stage but produce customers at a sustainable acquisition cost.
That is why lead generation reporting should not stop at impressions, clicks or form submissions. Each metric should explain whether prospects are moving to the next meaningful funnel stage.
Use internal advertising, analytics, CRM and revenue data to measure performance. Use the AdSpyder Ad Library only to add external context about competitor ads, offers and messaging—not as a source of competitor financial results.
This guide explains the full impression-to-revenue KPI chain, formulas, funnel definitions, reporting ownership and common measurement errors.
Table of Contents
What Are Lead Generation KPIs?
Lead generation KPIs are measurable business outcomes used to evaluate how efficiently marketing turns audience exposure into qualified demand, sales opportunities, customers and revenue.
A KPI should be connected to a decision. If a number changes but nobody knows what action to take, it is probably a supporting metric rather than a primary KPI.
Practical Rule: Every KPI should answer one of three questions: Are we attracting the right people? Are they advancing through the funnel? Are they creating enough commercial value?
KPIs vs Diagnostic Metrics
| Metric Type | Examples | Primary Use |
|---|---|---|
| Business KPIs | CPQL, cost per SQL, pipeline, CAC, revenue ROAS | Judge commercial value and budget efficiency. |
| Diagnostic Metrics | Impressions, CTR, CPC, form completion, speed to lead | Explain why a business KPI improved or declined. |
Define MQL, SQL and Opportunity Before Reporting
MQL and SQL are business-defined lifecycle stages, not universal scoring standards. A company must document what qualifies a lead for each stage before calculating conversion rates.
A practical set of definitions may look like this:
- Lead: A valid person or company that completed the intended conversion.
- MQL: A lead meeting marketing’s documented fit and engagement criteria.
- SQL: A lead accepted by sales as a credible potential customer.
- Opportunity: An SQL connected to an active sales deal.
- Customer: A person or company associated with a completed sale.
Reference: HubSpot Lifecycle Stage Guidance. Customize the stages to your actual sales process and keep the definitions consistent across reports.
The Impression-to-Revenue KPI Chain
Organize the dashboard into six layers so teams can see exactly where funnel performance changes.
Layer 1
Reach
Impressions, reach, impression share and CPM show whether the campaign is entering enough relevant auctions.
Layer 2
Engagement
CTR, CPC and click-to-session rate show whether the ad earns relevant traffic efficiently.
Layer 3
Lead Capture
Landing-page conversion, form completion, CPL and invalid-lead rate measure conversion friction.
Layer 4
Qualification
Valid lead rate, MQL rate, SQL rate, CPQL and cost per SQL measure lead usefulness.
Layer 5
Pipeline
Opportunity rate, pipeline value, average deal value and sales-cycle length show sales progression.
Layer 6
Revenue
Win rate, CAC, revenue ROAS, marketing ROI and LTV-to-CAC measure financial outcomes.
Use Ad Analytics to understand competitor campaign presence, funnel positioning and keyword activity. Keep your internal KPI calculations inside your advertising, analytics, CRM and finance systems.
Lead Generation KPI Formulas
| KPI | Formula | What It Answers |
|---|---|---|
| CTR | Clicks ÷ impressions × 100 | Does the ad earn attention? |
| CPC | Ad spend ÷ clicks | What does each click cost? |
| Landing-Page Conversion Rate | Leads ÷ landing-page sessions × 100 | Does the page convert relevant visits? |
| CPL | Ad spend ÷ total leads | What does each submitted lead cost? |
| Valid Lead Rate | Valid leads ÷ total leads × 100 | How much lead volume is usable? |
| Lead-to-MQL Rate | MQLs ÷ total leads × 100 | How much volume meets marketing criteria? |
| MQL-to-SQL Rate | SQLs ÷ MQLs × 100 | How often does sales accept MQLs? |
| CPQL | Ad spend ÷ qualified leads | What does each qualified lead cost? |
| Cost per SQL | Ad spend ÷ SQLs | What does each sales-accepted lead cost? |
| SQL-to-Opportunity Rate | Opportunities ÷ SQLs × 100 | How often do SQLs become active deals? |
| Pipeline-to-Spend Ratio | Attributed pipeline ÷ ad spend | How much potential pipeline did spend create? |
| Win Rate | Customers ÷ opportunities × 100 | How efficiently are opportunities closed? |
| Paid Media CAC | Ad spend ÷ new customers | What did media spend cost per customer? |
| Blended CAC | Sales and marketing cost ÷ new customers | What did complete acquisition cost? |
| Revenue ROAS | Attributed revenue ÷ ad spend | How much revenue did each spend unit produce? |
| Marketing ROI | (Attributed gross profit − marketing cost) ÷ marketing cost × 100 | Did marketing generate profit after cost? |
Do Not Confuse Pipeline With Revenue: Pipeline is potential deal value. Report it as a pipeline-to-spend ratio, then report completed revenue separately.
Worked Lead Generation KPIs Example
The following example is illustrative. It is not an AdSpyder customer result or an industry benchmark.
500,000
10,000
₹5,00,000
500
400
200
80
32
8
₹40,00,000
₹12,00,000
| Calculated KPI | Result |
|---|---|
| CTR | 2% |
| CPC | ₹50 |
| Landing-Page Conversion Rate | 5% |
| CPL | ₹1,000 |
| Valid Lead Rate | 80% |
| Lead-to-MQL Rate | 40% |
| MQL-to-SQL Rate | 40% |
| CPQL Using MQLs | ₹2,500 |
| Cost per SQL | ₹6,250 |
| SQL-to-Opportunity Rate | 40% |
| Win Rate | 25% |
| Paid Media CAC | ₹62,500 |
| Pipeline-to-Spend Ratio | 8× |
| Revenue ROAS | 2.4× |
How to Diagnose Funnel Leakage
| Symptom | Likely Issue | Next Check |
|---|---|---|
| Low Impressions | Budget, targeting, bids or limited demand | Auction coverage and keyword demand |
| High Impressions, Low CTR | Weak relevance, creative or offer | Message and audience alignment |
| Good Clicks, Low Page Conversion | Post-click mismatch or form friction | Headline, CTA, proof and form |
| Low CPL, Low Valid-Lead Rate | Loose targeting, spam or misleading offer | Search terms, placements and validation |
| Good MQL Volume, Low SQL Rate | Weak qualification or sales handoff | MQL criteria and rejection reasons |
| Strong Pipeline, Weak Revenue | Low win rate, long cycle or inflated value | Opportunity age and closed-lost reasons |
| Good ROAS, Weak Profit | Low margins or incomplete cost accounting | Gross profit and blended CAC |
When the problem appears between the click and the lead, compare competitor post-click structures with Landing Page Analysis. Use the findings to create a hypothesis, then validate it with your own page and CRM data.
Which KPIs Should Each Team Own?
Paid Media
CTR, CPC, landing-page conversion, CPL, search-term waste and CPQL.
Marketing Operations
Valid lead rate, MQL rate, duplicate rate, attribution and lifecycle timestamps.
Sales
Contact rate, speed to lead, MQL-to-SQL rate, opportunity rate and win rate.
Leadership
Pipeline, pipeline-to-spend, CAC, revenue ROAS, marketing ROI and LTV-to-CAC.
How to Build a Lead Generation KPIs Dashboard
- Document lifecycle stages and qualification rules.
- Standardize UTM parameters and preserve the original lead source.
- Connect advertising platforms, analytics, forms and the CRM.
- Import qualified, opportunity and customer outcomes where supported.
- Store timestamps for every meaningful stage transition.
- Track duplicate, spam and disqualification reasons.
- Use one attribution model consistently within each comparison.
- Account for conversion lag before judging recent campaigns.
For Google search campaigns, use Google Ads Spy to compare public competitor keyword themes and ad messages. Do not use competitor observations as substitutes for your account’s conversion and revenue data.
How AdSpyder Adds Competitor Context
Internal KPIs tell you where your funnel is weak. Competitive intelligence can help you generate better hypotheses about why.
1. Identify the Weak Funnel Stage
Use your own KPI dashboard to determine whether the issue is reach, engagement, capture, qualification, pipeline or revenue.
2. Review Competitor Domain Activity
Use URL Domain Analysis to compare visible platform activity, keyword themes, campaign presence and destination pages.
3. Compare Platform-Specific Messaging
Use Facebook Ads Spy when testing whether Meta competitors use different hooks, offers, proof or calls to action.
4. Build an Original Test
Turn the observed gap into a controlled hypothesis. Change one important variable and define the KPI expected to move.
5. Optimize Using Internal Performance Rules
The Campaign Optimisation AI Agent can apply account-defined conditions using metrics such as spend, conversions, CPA or ROAS after sufficient data and guardrails are set.
Important Limitation: AdSpyder cannot reveal a competitor’s CTR, CPC, CPL, MQL rate, SQL rate, CAC, CRM data, pipeline, revenue or ROAS.
Common Lead Generation Measurement Mistakes
Reporting Leads Without Qualified Leads
Submission volume can hide poor fit, spam and duplicates.
Calling Every Submission an MQL
An MQL should meet documented qualification criteria.
Treating CPL as the Main Business KPI
Low CPL can coexist with high CPQL and weak pipeline.
Calling Ad Spend Full CAC
Full CAC may include sales, software, agency and labor costs.
Treating Pipeline as Revenue
Open deals can be lost, delayed or reduced.
Ignoring Conversion Lag
Recent campaigns may not have had enough time to create revenue.
Lead Generation KPIs Checklist
FAQs for Lead Generation KPIs
What Are the Most Important Lead Generation KPIs?
Prioritize CPQL, MQL-to-SQL rate, cost per SQL, opportunity creation rate, pipeline, CAC, revenue ROAS and marketing ROI. Use CTR, CPC and CPL as supporting diagnostic metrics.
What Is the Difference Between CPL and CPQL?
CPL includes every submitted lead. CPQL includes only leads meeting a documented qualification standard.
What Is a Good MQL-to-SQL Rate?
There is no universal benchmark. Compare against a consistent internal baseline using unchanged MQL and SQL definitions.
Is Pipeline the Same as Revenue?
No. Pipeline is potential value from active opportunities. Revenue is completed value and should be reported separately.
How Should Lead Generation ROI Be Calculated?
Use attributed gross profit rather than revenue when calculating profit-based marketing ROI. Keep revenue ROAS as a separate advertising-efficiency metric.
Can AdSpyder Show Competitor CPL or CAC?
No. Competitor cost, CRM, pipeline and revenue metrics are private. AdSpyder helps reveal publicly observable ad and landing-page strategies.
Sources and Further Guidance
Connect Competitive Context With Campaign Performance
Research competitor positioning first, then use your own conversion, qualified-lead and revenue data to launch and optimize campaigns responsibly.