Quick Answer
The most reliable signal for a competitor’s best-performing ad format is ad longevity — how long a creative keeps running. An ad still active 30+ days after first appearing means the advertiser kept paying for it. Using AdSpyder’s Ad Library, which indexes 360 million+ ads across 10 platforms, you can filter any competitor’s ads by platform, sort by run duration, and identify which formats produce long-running creatives — no account access needed.
Most media buyers look at competitor ads and copy what looks good. That’s the wrong signal. You have no idea whether the ad you’re looking at ran for two days or two years. An ad that ran for two days is a test that probably failed. An ad that ran for six months is almost certainly a winner.
The problem isn’t that competitor format intelligence is unavailable — it’s that most people don’t know how to read it. This guide shows you exactly how to use ad longevity data to identify which creative formats your competitors have found to work, platform by platform.
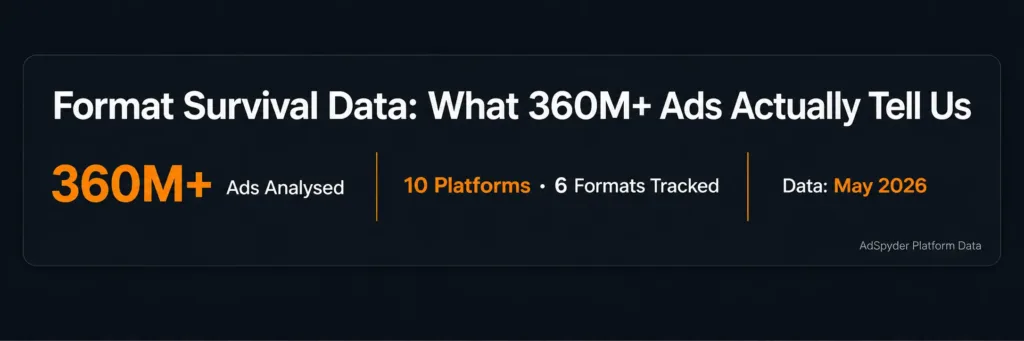
Every benchmark in this guide comes from AdSpyder’s own archive of 360 million+ ads across 10 platforms — actual first-seen and last-seen data on real campaigns, not surveys or estimates.
In This Guide
Why Ad Longevity Is the Best Proxy for Format Performance
You don’t have access to a competitor’s CTR, ROAS, or cost per click. Nobody outside their ad account does. What you do have access to is whether the ad is still running.
Here’s the logic: advertisers kill ads that don’t work. If a creative is still running 30, 60, or 90 days after it first appeared, the advertiser made a deliberate decision — multiple times — to keep paying for it. That’s a performance signal. It’s not perfect, but it’s the strongest public signal available from an ad library feed.
AdSpyder tracks firstSeen and lastSeen dates for every ad in its archive. The gap between those two dates is ad longevity. When you aggregate longevity by format — image vs video vs carousel — you get something no other source provides: a platform-level benchmark for which format type produces the highest survival rate in real advertiser decisions.
Important caveat
“LastSeen” is the last date AdSpyder observed the ad in the wild. For ads still running today, that means the measured duration is a floor, not the true lifetime. Actual survival rates may be higher than the numbers below.
Format Survival Data: What 360M+ Ads Actually Tell Us
Source: AdSpyder ad archive, May 2026. Sample sizes noted per platform.
Before you analyse a single competitor, you need the baseline — what format survival looks like industry-wide on each platform. Here’s the format mix as it stands today, then the survival rates.
Current format mix by platform
100%
Text
Google Search · 164M+ ads
88%
Image (historical)
Meta 2018–2024 · 43.9M ads
42%
Video (live feed)
Meta real-time 2025–26 · 11M+ ads
69%
Image
LinkedIn · 10k-doc sample
AdSpyder platform data, May 2026
Meta’s format landscape changed completely
Meta’s historical archive (43.9M ads, 2018–2026) is 88% single image. The live feed of 11M+ current ads is 42% video, 30% carousel, and only 27% single image. If you’re studying Meta format strategy from content written two or three years ago, you’re reading an outdated playbook.
Format survival rates: % of ads still running after 30 days
| Platform | Format | 30-Day Survival | Sample (n) |
|---|---|---|---|
| Meta (historical) | Image only | 8.0% | 7,065 |
| Meta (historical) | Video | 14.9% | 917 |
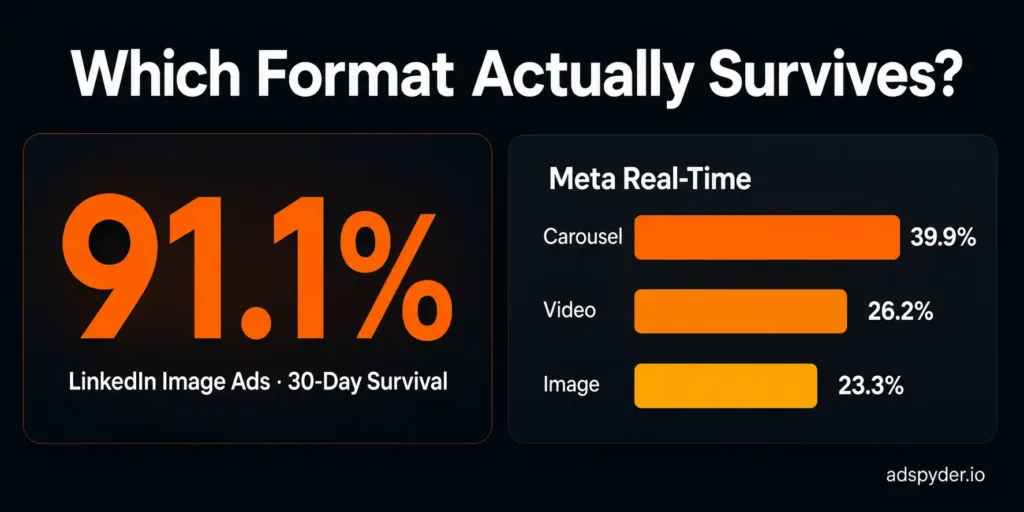
| Meta (real-time) | Single image | 23.3% | 5,271 |
| Meta (real-time) | Video | 26.2% | 8,299 |
| Meta (real-time) | Carousel | 39.9% | 5,954 |
| Image | 91.1% | 6,931 | |
| Video | 39.8% | 1,956 | |
| Text-only | 27.1% | 1,113 | |
| YouTube | Video (all) | 22.1% | 5,000 |
Source: AdSpyder ad archive, May 2026. Survival = % of ads still observed 30+ days after firstSeen.
What the Data Actually Says About Which Format Wins
The table contains three findings that should change how you approach format research. None of them match the “video-first, everywhere” advice you’ll find on most marketing blogs.
Finding 1: Carousel is the highest-surviving format on Meta right now
On Meta’s live feed (11M+ ads running in 2025–2026), carousel ads survive past 30 days at 39.9% — compared to 26.2% for video and 23.3% for single image. That’s not a small edge. When you see a competitor running carousels on Meta consistently, that’s a real format signal, not a creative preference.
Finding 2: LinkedIn completely inverts the format hierarchy
LinkedIn image ads survive past 30 days at 91.1% — the highest survival rate of any format on any platform in AdSpyder’s entire archive. Video drops to 39.8%. Text-only sits at 27.1%. If you’re running video-first on LinkedIn because it works on Meta, you’re working against the platform’s own data. LinkedIn’s professional feed rewards polished static creative — a well-designed stat card or product visual — in ways entertainment-first platforms don’t.
Finding 3: On Meta, video wins — but only compared to static image
In Meta’s historical archive, video survives at nearly 2× the rate of single image (14.9% vs 8.0%). In the real-time feed, video still edges out single image (26.2% vs 23.3%). But both lose to carousel. If a competitor is running video on Meta, they’re probably making a reasonable call. If they’re running carousels, they’re likely making an even better one.
5-Step Workflow: How to Read a Competitor’s Format Strategy
Pull the competitor’s full ad archive by domain
Go to AdSpyder’s Ad Library and search by the competitor’s root domain. Don’t filter by platform yet — pull everything first to see which platforms they’re actually active on. AdSpyder indexes across Facebook, Google, LinkedIn, YouTube, and more — so you get the full picture in one place before you narrow down.
Sort by first-seen date and look for repeated formats
Sort results from oldest to newest. Look at ads with the widest gap between first-seen and last-seen dates. Note what those ads have in common — are the long-runners mostly video, mostly image, or does a specific format dominate? Also check what format fills the graveyard of short-lived ads. Both are useful signals.
Apply the 30-day threshold
Filter to ads where the run duration is 30 days or more. This is your survivor cohort — the ads their team looked at after a month and decided to keep spending on. Count the format breakdown within that cohort. If 7 out of 10 thirty-day survivors are carousel, that’s your answer. Build your format hypothesis from this cohort, not from the full archive.
Cross-reference against the platform survival benchmark
Use the survival table above as context. If 39.9% of all carousel ads on Meta survive 30 days industry-wide but your competitor’s carousel survival is 60%, they’re outperforming the platform average — that’s a format strategy worth reverse-engineering in depth. If they’re at 22%, they’re at or below baseline. Context changes everything.
Replicate the format pattern — not the creative
You’re not copying their ad. You’re using their format choices as a validated hypothesis. If their 30-day survivors on LinkedIn are all single-image with a bold stat in the top third, that’s the template to test. Build 3–5 creative variants in that format, run them in parallel, and measure against your own 30-day threshold. You’ve replaced guesswork with a data-backed starting point.
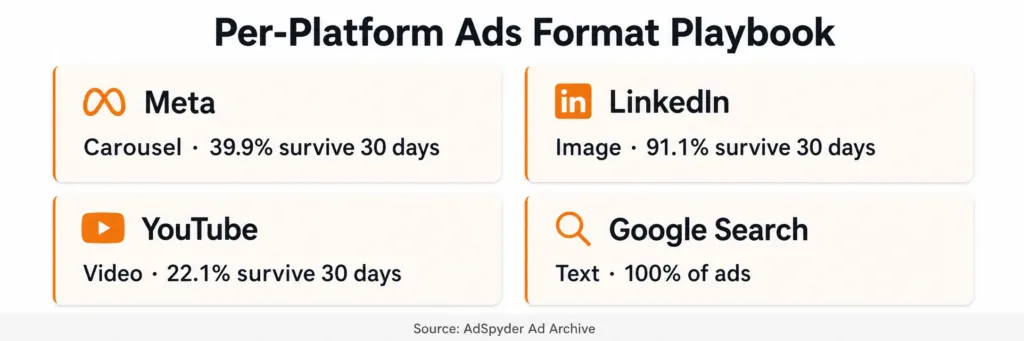
Per-Platform Format Playbook
The workflow above applies to every platform. But what you should be looking for differs by platform. Here’s what the data says about each one.
Meta (Facebook & Instagram)
Look for carousels in their 30-day survivors. On the live Meta feed, carousel is the highest-surviving format at 39.9% — well ahead of video (26.2%) and single image (23.3%). If a competitor has shifted from image-heavy to carousel-heavy over the past 12 months, that’s a strategic move backed by platform behaviour, not just aesthetics.
Also note: the historical archive is 88% image but the live feed is only 27% single image. A competitor still running mostly single-image on Meta today is using a 2026 playbook. One running carousels and video is current. Use AdSpyder’s Facebook Ads Spy to track their format evolution over time. Also see this detailed guide on how to analyse competitor Facebook ads for a deeper Meta workflow.
The platform that inverts every assumption. Image ads survive at 91.1% past 30 days — the highest of any format on any platform in AdSpyder’s entire 360M+ ad archive. When you look at a competitor’s LinkedIn ads, check how many of their long-runners are static image versus video. If they’ve figured out LinkedIn, you’ll see a large proportion of well-designed single-image ads dominating their 30-day cohort.
Video on LinkedIn survives at 39.8% — still solid, but less than half the image rate. If a competitor is running heavy video on LinkedIn, they’re either doing so for brand awareness or they haven’t optimised their format mix yet. Either way, there’s an opening. Explore competitor LinkedIn ads via AdSpyder’s LinkedIn Ad Library.
YouTube
YouTube is 100% video — every ad in AdSpyder’s 2.5M+ YouTube archive carries a video ID. There’s no image vs video split to do. Instead, apply the longevity lens to video style: are their 30-day survivors long-form (30s+) or short? Skippable or bumper? The format distinction on YouTube is video length and skip behaviour, not media type.
22.1% of YouTube ads in AdSpyder’s archive survive past 30 days. That’s the platform benchmark. Use AdSpyder’s YouTube Ads Spy to identify competitors whose YouTube survival rate beats that baseline.
Google Search
Format analysis doesn’t apply here in the traditional sense — Google Search ads are ~100% text (only 114 of 164M+ ads in AdSpyder’s archive carry any image payload). What you analyse instead is copy structure: headline count, extension usage, description patterns, and CTA language. The longevity lens still works — a text ad running 30+ days is a winner worth studying — but the variable is copy architecture, not media format. Use AdSpyder’s Google Ads Spy to pull competitor text ads and sort by run duration.
Platform format strategy at a glance
| Platform | Top surviving format | What to look for in competitor data | AdSpyder tool |
|---|---|---|---|
| Meta | Carousel (39.9%) | Are their 30-day survivors carousels? | Facebook Ads Spy |
| Image (91.1%) | What % of their long-runners are static image? | LinkedIn Ad Library | |
| YouTube | Video — all (22.1%) | Video length and style in 30-day survivors | YouTube Ads Spy |
| Google Search | Text — all (no format split) | Headline count, extensions, copy structure | Google Ads Spy |
| Amazon | Product image (dominant) | Number of variants per campaign (median: 5) | Amazon Ad Library |
3 Format Research Mistakes That Lead You the Wrong Way
Mistake 1: Copying recently-launched ads
A new ad is not a proven ad. If you see a competitor launch a flashy video and copy it two weeks later, you’re betting on an experiment they haven’t validated yet. Only study ads that have run for 30+ days. Everything else is still being tested.
Mistake 2: Applying Meta format logic to LinkedIn
This is the most common error. “Video works on Meta, so I’ll run video everywhere” is not a strategy — it’s a platform mismatch. The data is clear: LinkedIn image ads survive at 91.1% past 30 days. LinkedIn video ads survive at 39.8%. If you run video-first on LinkedIn because it works on Meta, you’re actively working against the platform’s behaviour patterns. Study competitors per platform, not as a whole.
Mistake 3: Treating ad volume as a format signal
A competitor running 50 video ads doesn’t mean video is their best format. It might mean they’re testing heavily and most are failing. Volume tells you effort. Longevity tells you outcome. Always sort by run duration before drawing format conclusions.
Format Research Checklist
Before you decide on a format based on competitor research, confirm you’ve done all of these.
✓
Pulled the competitor’s full ad archive by domain in AdSpyder
✓
Filtered to ads running 30+ days only (not recently launched)
✓
Counted format breakdown within that 30-day survivor cohort
✓
Cross-referenced against the platform benchmark survival rates above
✓
Done this separately per platform (not rolled up across platforms)
✓
Noted whether competitor is above or below the platform baseline survival rate
✓
Built 3–5 creative variants in the competitor’s dominant survivor format as a test hypothesis
Stop guessing. Start reading format signals.
AdSpyder indexes 360M+ ads across 10 platforms with first-seen and last-seen dates. Filter any competitor’s archive by platform, sort by run duration, and identify the formats that actually survive — in under 5 minutes.