Do you scratch your head at the sight of numbers and decimals? Do you also find it difficult to retain information with numbers in it, just like we do? This IT world today has us all completely bombarded with boring data and statistics. At times it can get quite overwhelming to understand and remember all of it. Numbers often fail to look interesting to people in their original form, no matter how valuable they are. This is where video infographics swoop in – a powerful tool used to transform any dry data into video infographics. By combining this boring data visualization with some interesting animation and storytelling, video infographics can explain some complex concepts, present research findings, and engage viewers in a way that static charts and graphs simply cannot.
With this comprehensive guide, we’re going to explore with you the power of video infographics and their effectiveness in communicating information. We’ll be diving into the unique strengths of this format, exploring various animation styles and tools for creating video infographics, and even showcasing a few inspiring examples from across different industries. We’ll provide you with a few practical tips for crafting engaging video infographics, including scriptwriting, data visualization techniques, and effective storytelling approaches. Finally, we will discuss strategies that can be used to promote your video infographics and also maximize their reach.
Summary
In this exclusive blog, we’re going to discuss with you :
- An Introduction to Video Infographics: Highlighting the challenges of communicating data effectively and the growing importance of video infographics.
- The Power of Video Infographics: Exploring the unique strengths of video infographics in engaging viewers and explaining complex information.
- Animation Styles for Video Infographics: Unpacking different animation techniques suitable for creating effective video infographics.
- Tools for Creating Video Infographics: Showcasing user-friendly software and online platforms for beginners and professionals alike.
- Crafting Compelling Video Infographics: Providing practical tips for scriptwriting, data visualization, and storytelling to create engaging video infographics.
- Optimizing Video Infographics for Success: Discussing strategies for promoting your video infographics and maximizing their reach.
- Some FAQs: Addressing eight of the most frequently asked questions regarding video infographics.
- Conclusion: Finally, a short recap emphasizing the transformative potential of video infographics. Final thoughts on the evolving video landscape and the continuous need for creative content formats.
Why Video Infographics Matter: The Power of Animation
Data is crucial for making informed decisions, understanding trends, and measuring progress. However, presenting this data effectively can be a challenge. Static charts and graphs are quite boring and often lack visual appeal which tends to overwhelm viewers with information overload.
Video infographics overcome these challenges by combining data visualization with interesting animation and storytelling. Let us explain to you why video infographics are ideal for transforming dry data into engaging and memorable content:
- Visual Appeal: Animation and motion graphics capture attention and make data come alive. Interactive elements and dynamic visuals enhance understanding and retention of information.
- Storytelling Power: Videos allow you to weave a narrative around your data, making it relatable and engaging for viewers. You can explain the context, highlight key insights, and connect with viewers on an emotional level.
- Improved Comprehension: Animation can simplify complex data sets and relationships, making them easier to understand for viewers with varying levels of technical knowledge.
- Information Retention: The combination of visuals, audio, and storytelling enhances information retention compared to static data presentations.
- Versatility: Video infographics can be tailored to different audiences and communication goals. You can create explainer videos, product demos, educational content, or social media posts, all leveraging the power of data visualization. It is also best suited for video testimonials, where combination of statistics and user testimonies provide the right boost.
Leveraging the Power of Animation in Video Infographics
- Communicate complex data & research findings: Present data in a clear, concise, and visually engaging way to a broader audience.
- Showcase trends & patterns: Use animation to highlight trends and relationships within data sets, uncovering insights that might be missed in static presentations.
- Explain processes & procedures: Break down complex processes or workflows into step-by-step visual explanations using animation.
- Boost audience engagement: Captivate viewers with compelling visuals and storytelling, fostering deeper understanding and improving retention of information.
- Increase brand awareness & trust: High-quality and informative video infographics can enhance your brand image and establish you as a thought leader within your industry.
Animation Styles for Video Infographics: Bringing Data to Life
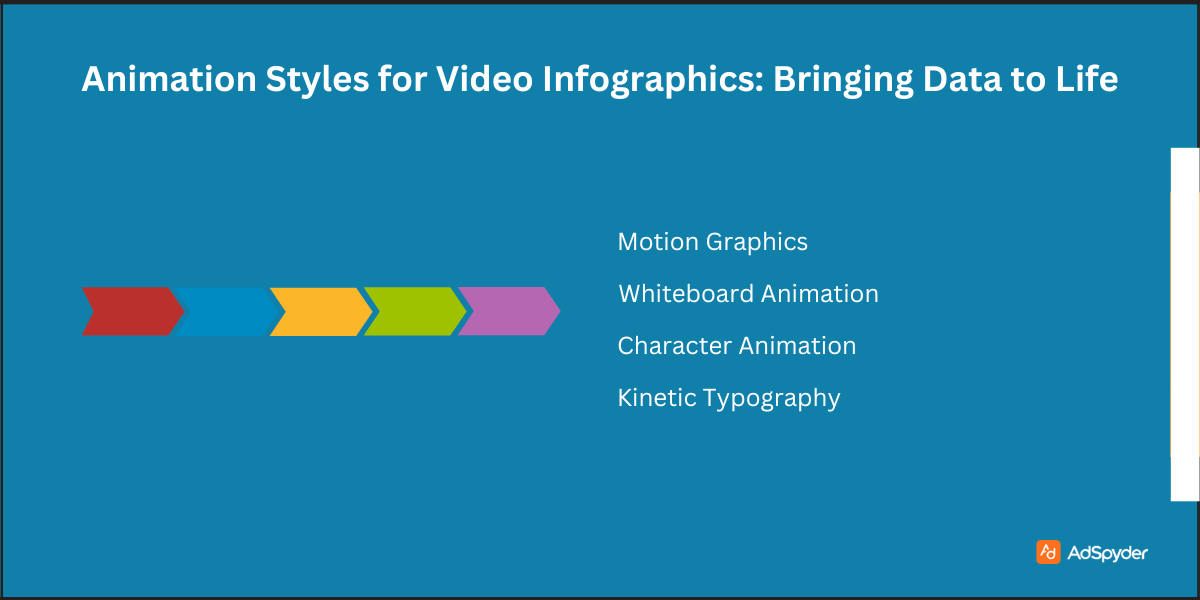
The animation style that you choose for your video infographic plays a crucial role in how viewers perceive and engage with your data. Allow us to introduce you to some popular animation styles, along with their strengths and considerations :
Motion Graphics
This widely used style utilizes geometric shapes, text elements, and dynamic transitions to present data in a cleaner, more modern way. Motion graphics are versatile and can be adapted to various data sets and communication goals.
Strengths
- Clean and professional aesthetic: Motion graphics create a polished and modern look, ideal for corporate presentations or data-driven explainer videos.
- Flexibility: This style can be adapted to different complexities of data and can incorporate various data visualization techniques like charts, graphs, and maps.
- Scalability: Motion graphics can be easily scaled to fit different video formats and platforms.
Considerations
- Can appear impersonal: The focus on clean visuals and minimalism might not be ideal for creating a strong emotional connection with viewers.
- Requires design skills: Creating high-quality motion graphics often requires design expertise or collaboration with a motion graphics artist.
Whiteboard Animation
This technique simulates a hand drawing on a whiteboard, which creates a casual and more engaging feel. It’s ideal for explaining processes or concepts in a step-by-step and relaxed manner.
Strengths
- Approachable and engaging: The hand-drawn style fosters a sense of connection with viewers and feels less formal than traditional animations.
- Easy to understand: The step-by-step approach is ideal for explaining complex concepts or processes in a clear and sequential manner.
- Cost-effective: Whiteboard animation can be created with relatively simple tools and software, making it accessible for even small businesses.
Considerations
- Limited visual complexity: Whiteboard animation might not be suitable for presenting highly detailed data sets or complex relationships.
- Can feel less polished: Compared to motion grapResourcesteboard animation has a less polished aesthetic, which might not be ideal for all audiences.
Character Animation
This style incorporates animated characters to deliver information or guide viewers through the data. It’s a great way to engage viewers by adding personality and humor to your video infographic.
Strengths
- Highly engaging: Characters can add personality and humor to your video, making it more engaging and memorable for viewers.
- Storytelling potential: Characters allow you to develop a narrative around your data, making it more relatable and impactful.
- Wide range of styles: Character animation can be created in various styles, from simple and cartoony to detailed and realistic.
Considerations
- More time-consuming: Character animation can be more time-consuming and resource-intensive to create compared to other styles.
- Not ideal for all data sets: This style might not be suitable for all types of data, particularly highly technical or complex information.
Kinetic Typography
This technique uses animated text to convey information and create a visually dynamic experience. It’s ideal for showcasing statistics, quotes, or key takeaways.
Strengths
- Visually striking: Kinetic typography can be visually captivating and grab viewers’ attention.
- Emphasis on key points: This style allows you to highlight important information through text animation and visual emphasis.
- Relatively simple to create: Kinetic typography can be created with user-friendly software and doesn’t require complex animation skills.
Considerations
- Limited data visualization: Kinetic typography is not ideal for presenting complex data sets or relationships that require visual charts or graphs.
- Accessibility concerns: Heavy reliance on text might pose challenges for viewers with certain visual impairments.
Choosing the perfect animation style for your video infographic depends on the type of data that you’d like to represent, your target audience, and your communication goals. Consider the level of detail and complexity of your data, the desired tone and style of your video, and your budget and resources.
It is not a hard and fast rule to only pick a single style. You can even combine different animation styles within a single video infographic to create an even more dynamic and engaging experience. The key is to choose a style that complements your data and effectively communicates your message to your target audience.
Tools for Creating Video Infographics: From Beginner to Pro
There are several user-friendly software programs and platforms available online to cater to both beginners and experienced designers. Here are some popular options to consider:
- Biteable: A user-friendly online platform with drag-and-drop functionality and a vast library of pre-made templates, animations, and stock footage. It is ideal for beginners with no prior design experience.
- Powtoon: Another user-friendly online platform offering pre-designed templates, animations, and characters to create engaging video infographics. Powtoon provides a free plan with limited features and paid plans with additional functionalities.
- Adobe Spark Video: A free and easy-to-use mobile app from Adobe that allows you to create short, social media-friendly video infographics with text, images, and animations. Ideal for quick and on-the-go content creation.
- Vyond: A cloud-based platform offering a vast library of pre-built characters, scenes, and props, along with animation tools to create professional-looking explainer videos and video infographics. Vyond offers a free trial and various paid subscription plans.
- Animaker: An online platform with a wide range of animation styles, including 2D, explainer videos, whiteboard animation, and character animation. Animaker provides a free plan with limited features and paid plans with additional functionalities.
- Renderforest: An online platform specifically designed for creating video infographics. Renderforest offers a library of pre-designed templates, icons, and animations, along with data visualization tools to create engaging data-driven videos. They offer a free plan with limited exports and paid plans for additional features.
- Adobe After Effects: A professional-grade animation software offering extensive customization options and powerful tools for creating high-end motion graphics and animations. After Effects requires design expertise and is recommended for experienced users.
Video Infographics: Picking the Right Tool
The process of picking out the best tool for you includes weighing out your budget, design skills, and the level of complexity of your video infographic. If you’re a beginner, user-friendly online platforms like Biteable or Powtoon are a great starting point. As you continue to gain experience and confidence, you can explore advanced software like Vyond or Adobe After Effects. Remember, the most important factor is to choose a tool that allows you to effectively communicate your message and engage your target audience.
Crafting Compelling Video Infographics: Scriptwriting, Storytelling & Data Visualization
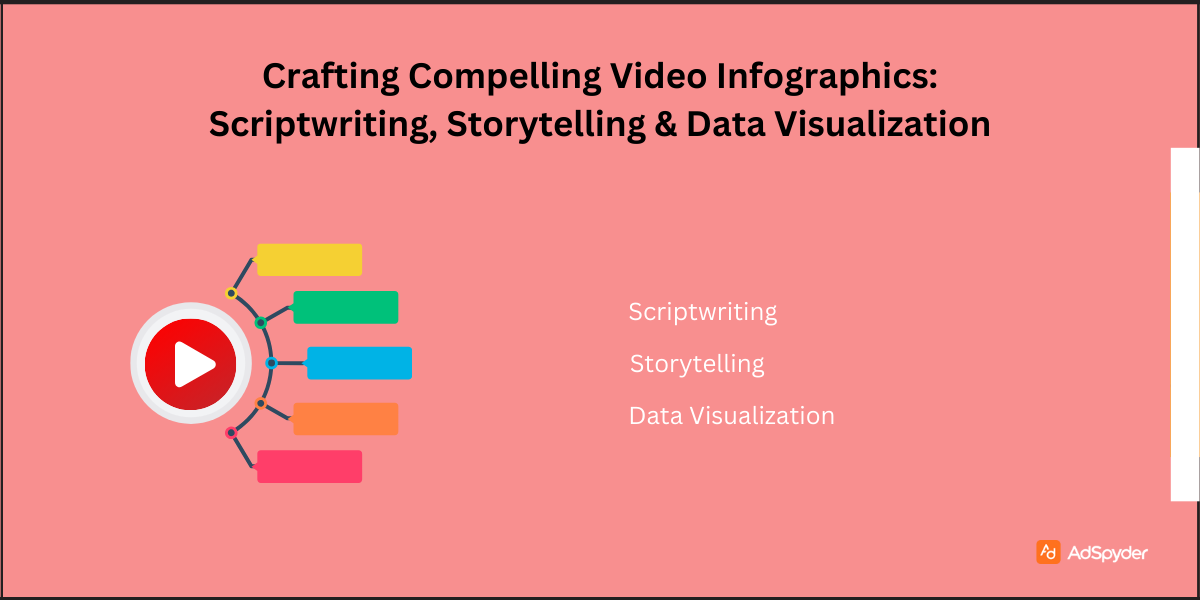
Now that you’ve chosen your animation style and creation tool, let us take you one step further into the nitty-gritty of crafting compelling video infographics. Here’s what you need to consider:
Scriptwriting
A well-written script forms the foundation of your video infographic. Here are some tips for writing an effective script:
- Start with a strong hook: Grab viewers’ attention in the first few seconds with a compelling opening statement, question, or statistic.
- Explain the context: Provide context for your data and highlight the key question or problem you’re addressing.
- Present your data: Use clear and concise language to explain your data and showcase it visually using charts, graphs, or other data visualization techniques.
- Tell a story: Weave a narrative around your data to make it relatable and engaging for viewers. Use storytelling techniques like conflict, resolution, and surprise to keep viewers hooked.
- End with a call to action: Tell viewers what you want them to do after watching your video infographic. This could be visiting your website, subscribing to your channel, or learning more about your product or service.
Storytelling
Don’t just present data; instead, tell a story. People tend to connect with stories on an emotional level, so use storytelling techniques to make your data relatable and impactful. Consider incorporating these elements:
- Characters: Even if you’re not using character animation, consider creating a relatable character (or audience persona) who faces a challenge that your data can help solve.
- Conflict: Highlight the problem or challenge that your data addresses.
- Resolution: Show how your data can help overcome the challenge and achieve a positive outcome.
- Surprise: Use unexpected facts or data points to keep viewers engaged and interested.
Data Visualization
Data visualization is the art of using visual elements like charts, graphs, and maps to represent data in a clear and understandable way. Here are some tips for effective data visualization:
- Choose the right chart type: Select the chart type that best represents the type of data you’re presenting. For example, use bar charts for comparisons, line graphs for trends, and pie charts for proportions.
- Keep it simple: Avoid overloading your viewers with too much information. Focus on the most important data points and ensure your visuals are easy to understand.
- Use clear labels and legends: Make sure your charts and graphs are properly labeled with clear titles, axes, and legends.
- Use color strategically: Color can be a powerful tool for highlighting key data points and making your visualizations more visually appealing. However, avoid using too many colors or using colors that clash. Consider using colorblind-friendly color palettes to ensure accessibility.
- Animate your data: Animation can be a great way to make your data visualization more engaging and dynamic. Use animation to highlight trends, reveal insights, or showcase changes over time.
By focusing on scriptwriting, storytelling, and effective data visualization, you can craft video infographics that not only inform but also captivate your audience.
Optimizing Video Infographics for Success: Distribution & Promotion
Creating a compelling video infographic is just half the battle. The next step is getting your content seen by your target audience. Here are some strategies for promoting your video infographic and maximizing its reach:
- Social Media Platforms: Share your video infographic on relevant social media platforms like LinkedIn, Facebook, Twitter, and YouTube. Optimize your post with relevant hashtags and a captivating caption that entices viewers to click and watch.
- Blog Posts & Articles: Embed your video infographic in blog posts or articles related to your topic. This helps drive traffic to your video and provides valuable context for viewers. For dropshippers on Shopify, these techniques not only boost sales, but also helps in building brand.
- Email Marketing: Include snippets of your video infographic in your email marketing campaigns to pique subscribers’ interest and encourage them to watch the full video.
- Paid Advertising: Consider using paid advertising platforms to reach a wider audience. You can target your ads to specific demographics and interests to ensure your video infographic reaches the people most likely to be interested in your data.
- Industry Websites & Publications: Submit your video infographic to relevant industry websites or publications. This can help you gain exposure to a targeted audience and establish yourself as a thought leader in your field.
- Optimize for Search Engines: Use relevant keywords in your video title, description, and tags to improve your video’s ranking in search engine results. This can help potential viewers discover your video infographic when searching for information online.
- Track Your Results: Monitor the performance of your video infographic using analytics tools. Track metrics like views, engagement, and click-through rates to understand how your video is performing and identify areas for improvement.
FAQs
Absolutely! Several user-friendly online platforms like Biteable or Powtoon offer pre-designed templates and require minimal design expertise. These platforms are a great starting point for beginners to create compelling video infographics.
The ideal length depends on your data and message. Aim for concise and focused content. Generally, video infographics perform well between 1-2 minutes in length, but you can adjust this based on your specific content.
Choose background music that complements your message and doesn’t overpower the narration or data visualization. Consider royalty-free music libraries to find suitable soundtracks.
Closed captions & subtitles: Add closed captions or subtitles in multiple languages to cater to viewers with hearing impairments or those who speak different languages.
Audio descriptions: For visually complex video infographics, consider adding audio descriptions that narrate the visual elements, enhancing accessibility for viewers with visual impairments.
Always ensure you have the proper licenses for any music or footage used in your videos. Use royalty-free music libraries or obtain permission from copyright holders before using copyrighted material.
Track your video’s performance using analytics tools. Monitor metrics like views, watch time, engagement (likes, comments, shares), and click-through rates to understand how your video infographic is performing and identify areas for improvement.
Conclusion
Before we bring this blog to a conclusion, let’s take a quick recap.
Recap
With this comprehensive guide, we have explored the transformative power of video infographics in data visualization and audience engagement. We’ve delved into the unique strengths of this format, explored various animation styles and tools for creating video infographics, and showcased inspiring examples from across different industries. We’ve also provided practical tips for crafting compelling video infographics, including scriptwriting, data visualization techniques, and effective storytelling approaches. Finally, this guide has discussed strategies for promoting your video infographics and maximizing their reach.
By leveraging the insights and strategies outlined in this guide, you can create high-quality, engaging video content that effectively communicates your message and resonates with your target audience. Remember, video infographics can be a valuable tool for:
- Reaching a wider audience: Engaging visuals and storytelling can attract viewers who might be turned off by traditional data presentations.
- Boosting information retention: The combination of visuals, audio, and storytelling enhances information retention compared to static presentations.
- Establishing thought leadership: High-quality video infographics can showcase your expertise and position you as a leader in your field.
- Driving conversions & sales: Compelling data visualization can effectively communicate the value proposition of your product or service, leading to increased conversions and sales.
Final Thoughts
The video marketing landscape is constantly evolving, presenting exciting opportunities for creators to leverage animation and storytelling to share information in engaging ways. Embrace new video formats like short-form video content popularized by platforms like TikTok and Instagram Reels. Experiment with interactive elements within your video infographics and explore the potential of virtual reality (VR) experiences to immerse viewers in your data and ignite their curiosity.
As technology advances, the possibilities for video infographics will continue to expand. The key lies in staying creative and innovative in your approach to data visualization and storytelling. Develop engaging narratives, prioritize user experience, and prioritize accessibility to ensure your video infographics reach a broad audience and leave a lasting impact.
Call to Action
Take action today and leverage the power of video infographics! Here are some initial steps to get you started:
- Identify a data set or story you want to share: Select a topic or data set relevant to your audience and with the potential to be visually compelling.
- Choose the right animation style: Consider your data, target audience, and communication goals to select the animation style that best compliments your message.
- Explore video infographic creation tools: Research user-friendly online platforms or software that aligns with your design skills and budget.
- Craft a compelling script: Develop a clear and concise script that effectively weaves data visualization, storytelling, and a call to action.
- Start creating your video infographic: Utilize the tips and tools explored in this guide to bring your data and story to life through engaging animation.
- Promote your video infographic: Share your content on relevant social media platforms, websites, and publications to reach your target audience.
- Track and analyze results: Monitor the performance of your video infographic using analytics tools and use the insights to refine your approach for future video content creation.
By embracing video infographics and prioritizing creative data visualization, you can transform complex information into engaging and memorable content, fostering a deeper understanding and connection with your audience. Let video infographics be your powerful tool to showcase your expertise, captivate viewers, and achieve your communication goals.