
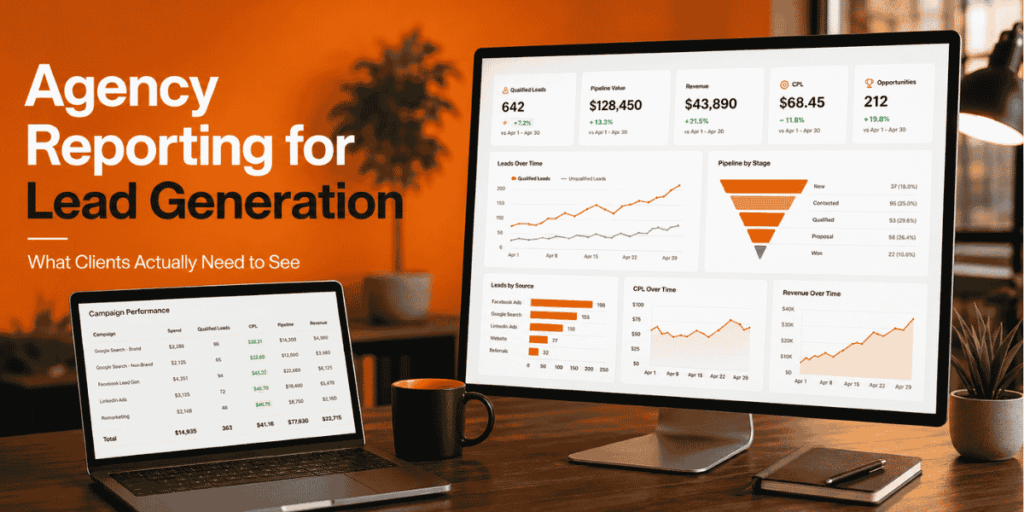
Quick Answer
- Open with qualified leads, opportunities, customers and revenue—not impressions.
- Show goal versus actual, period-over-period movement and the reason behind the change.
- Separate submitted, valid, qualified and sales-accepted leads.
- Keep open pipeline separate from completed revenue.
- Document attribution gaps, sales-cycle lag and missing CRM data.
- End with the next test, expected metric, owner and review date.
Lead generation reporting should answer four client questions: What business result occurred? Why did it happen? What changed in lead quality? What will the agency test next?
Clicks, impressions and CTR still help diagnose delivery, but they should support the story rather than become the story. The existing lead generation KPI framework shows why CPQL, pipeline, CAC and revenue matter more to commercial decisions.
Why Reporting Affects Agency Retention
Agency leaders in the benchmark study
Called reporting critical to retention
Reported 2–5 year client lifespans
Expected paid ads to deliver strongest results
AgencyAnalytics published these findings from its 2025 survey of agency leaders. The useful lesson is not that every agency should use the same dashboard; it is that transparent reporting supports strategic conversations and long-term trust.
Dashboard vs Monthly Client Report
| Live Dashboard | Monthly Report |
|---|---|
| Ongoing delivery metrics | Goal versus actual |
| Campaign monitoring | Funnel and pipeline analysis |
| Detailed charts and filters | Important findings only |
| Answers “What is happening?” | Answers “Why, so what and what next?” |
Recommended Reporting Rhythm
- Live Dashboard: Current spend, pacing, leads and operational status.
- Weekly Update: Risks, tracking issues, unusual lead quality and urgent actions.
- Monthly Report: Goal progress, funnel economics, observations and next tests.
- Quarterly Review: Strategy, budget, channel mix, commercial outcomes and account priorities.
The comparison of lead generation tools for agencies helps separate reporting platforms from CRM, attribution, research and campaign-delivery tools.
The REPORT Client Reporting Framework
What the Executive Summary Should Show
- Qualified leads finished 20% above target.
- CPQL improved because Google Search produced more valid enquiries.
- Opportunity volume missed target because SQL-to-opportunity conversion declined.
- The strongest offer generated fewer leads but twice as many opportunities.
- Next test: send comparison-intent traffic to a pricing page and review CPQL after 30 qualified leads.
Use the campaign audit checklist when the report exposes tracking, routing, qualification or sales-capacity problems that cannot be fixed through ad optimisation alone.
Goal Versus Actual Comes First
| Business Goal | Target | Actual | Status |
|---|---|---|---|
| Qualified Leads | 60 | 72 | Above Target |
| Sales Opportunities | 12 | 10 | Below Target |
| CPQL | $180 | $166.67 | Within Target |
| New Customers | 4 | 3 | Below Target |
This format immediately shows that lead quantity and CPQL improved while downstream opportunity and customer goals were missed. The agency can then investigate qualification, sales follow-up and offer-to-buyer fit.
Lead Quality and Funnel Reporting
| Stage | Volume | Stage Conversion |
|---|---|---|
| Submitted Leads | 180 | — |
| Valid Leads | 144 | 80% |
| Qualified Leads | 72 | 50% |
| SQLs | 32 | 44.4% |
| Opportunities | 10 | 31.3% |
| Customers | 3 | 30% |
Report the main disqualification reasons:
- Spam, duplicates or invalid contact details
- Wrong location, company size or service requirement
- Insufficient budget or unrealistic timing
- Job seekers, students or existing customers
- Unreachable leads or delayed sales follow-up
Google Ads provides qualified-lead and converted-lead goals plus Lead Journey Mapping. Agencies should import deeper CRM outcomes when consent, identifiers and data quality allow it.
Use the lead generation budget model to compare actual CPQL with the affordable lead cost supported by qualification, close rate and customer economics.
Worked Client Economics Example
Assume the agency spent $12,000 and produced the funnel above:
$66.67
$166.67
$375
$4,000
If completed revenue is $27,000, revenue ROAS is 2.25×. If another $60,000 remains open in the pipeline, report a 5× pipeline-to-spend ratio separately. Do not combine pipeline with completed revenue.
The competitor-ad research workflow can add external context when an offer or message underperforms, but the client’s CRM remains the source of lead-quality and revenue truth.
Channel and Campaign Quality
| Channel | Leads | Qualified | CPQL | Opportunities |
|---|---|---|---|---|
| Google Search | 70 | 42 | $143 | 7 |
| 35 | 18 | $222 | 2 | |
| Meta | 75 | 12 | $250 | 1 |
This example shows why lead volume alone can mislead. Meta produced the most leads but the weakest qualified-lead and opportunity output.
Use the creative testing framework to report which offer, proof, angle, format or CTA changed—and which business metric the test was expected to improve.
Metrics Clients Need Explained
| Metric | Formula | Why It Matters |
|---|---|---|
| Valid Lead Rate | Valid Leads ÷ Submitted Leads | Exposes spam and routing waste |
| CPQL | Spend ÷ Qualified Leads | Connects spend with lead quality |
| Cost per SQL | Spend ÷ SQLs | Measures sales-ready demand |
| Cost per Opportunity | Spend ÷ Opportunities | Shows pipeline efficiency |
| CAC | Total Acquisition Cost ÷ Customers | Measures full customer cost |
| Revenue ROAS | Completed Revenue ÷ Ad Spend | Keeps revenue separate from pipeline |
Also report the leading indicators that explain movement: CPC, page conversion rate, valid-lead rate, speed to lead, contact rate and appointment attendance. These help identify the bottleneck without replacing business outcomes.
Creative and Landing-Page Findings
A useful report does not list a “winning ad” without explaining what was tested. Summarise:
- Which offer produced the highest qualified-lead rate
- Which proof point improved sales acceptance
- Which page produced invalid or poor-fit enquiries
- Whether the CTA matched the visitor’s decision stage
- Whether mobile speed or form errors affected conversion
- Whether performance changed because of fatigue, seasonality or traffic mix
Tie every creative or page observation to a business metric. “The new image improved CTR” is incomplete when the qualified-lead rate declined.
Attribution and Data-Quality Warnings
- Use the same attribution window when comparing channels.
- Flag missing calls, offline sales and delayed CRM updates.
- Show duplicate, spam and unreachable-lead rates.
- Explain long sales-cycle lag before judging recent campaigns.
- Verify UTM, click-ID and revenue-field capture.
- Keep platform-attributed conversions separate from deduplicated CRM outcomes.
Google moved many enhanced-conversion and offline-upload workflows toward the Data Manager API on June 15, 2026. Agencies using older custom integrations should verify upload health and offline-data diagnostics.
How AdSpyder Adds Competitor Context
- Pull campaign, CRM and revenue results first.
- Identify the weakest funnel stage.
- Use Ad Analytics to compare visible competitor domains, platforms, keywords, ads and destinations.
- Review several competitors rather than one isolated creative.
- Convert one repeated pattern or market gap into an original test.
- Add the test, owner and primary KPI to the report.
The lead generation CTA dataset can provide market context for CTA commitment, but frequency should never be reported as evidence that a CTA will convert better for the client.
Use the landing-page destination analysis when the report shows strong click volume but poor post-click progression across pricing, signup, demo, trial or contact journeys.
Add Market Context to the Next Client Report
Compare visible competitor ads, keywords and landing pages, then turn one finding into a measurable client test.
Common Agency Reporting Mistakes
- Opening with impressions and clicks
- Calling every submission a qualified lead
- Reporting CPL without CPQL
- Treating pipeline as completed revenue
- Calling media spend full CAC
- Showing percentages without absolute numbers
- Hiding invalid leads or tracking gaps
- Presenting charts without interpretation
- Recommending tests without owners or deadlines
Monthly Lead Generation Reporting Checklist
- Goal versus actual appears first.
- Submitted, valid, qualified and sales-accepted leads are separated.
- Pipeline and completed revenue are reported separately.
- CPQL, SQL cost, opportunity cost and CAC are calculated.
- Channel quality is compared, not only volume.
- Attribution limitations and sales-cycle lag are visible.
- Creative and landing-page findings are explained.
- Every next action has an owner, metric and review date.
Frequently Asked Questions
What Should a Lead Generation Report Include?
Include targets, qualified leads, opportunities, customers, economics, attribution warnings, observations and next tests.
Should Agencies Report Clicks and Impressions?
Yes, as diagnostic metrics. Business outcomes should appear first unless awareness was the agreed objective.
What Is the Difference Between CPL and CPQL?
CPL uses every submitted lead. CPQL uses only leads that meet the agreed qualification criteria.
How Often Should Agencies Report?
Use a live dashboard, short weekly risk updates, a monthly decision report and a quarterly strategy review where appropriate.
Can AdSpyder Report Competitor Revenue or CPL?
No. It provides observable market context. Client and competitor private performance data remain unavailable.
Research Sources
- AgencyAnalytics 2025 Agency Benchmarks
- Google Qualified and Converted Leads
- Google Enhanced Conversions Updates
- AdSpyder Ad Analytics
Move the Report From Metrics to Decisions
Show the client what changed, why it matters and which measurable test comes next.